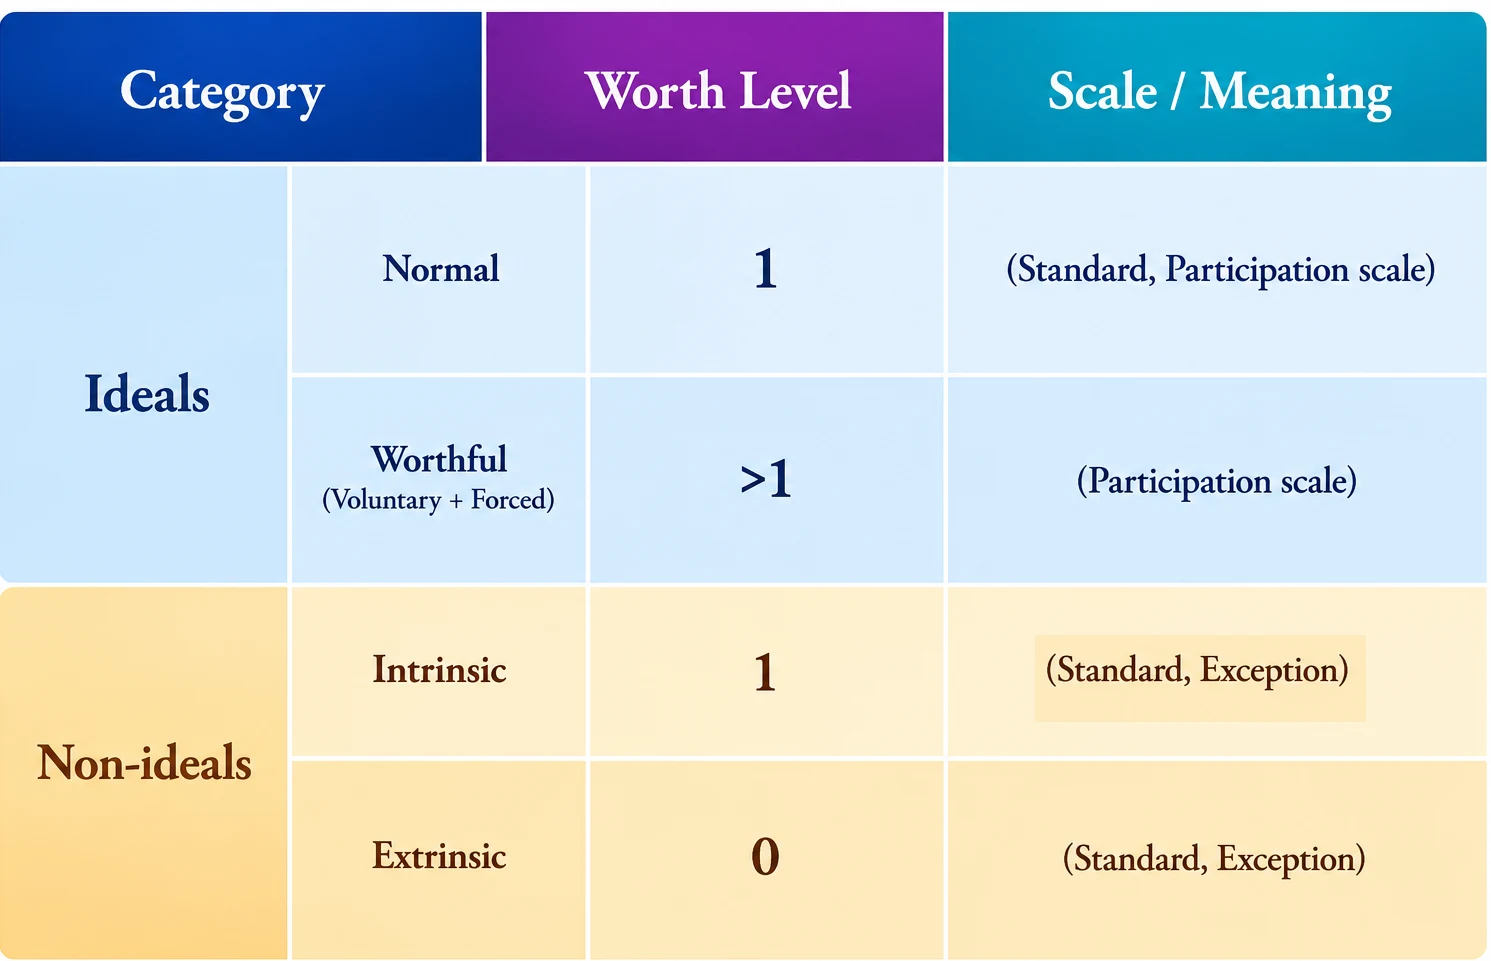
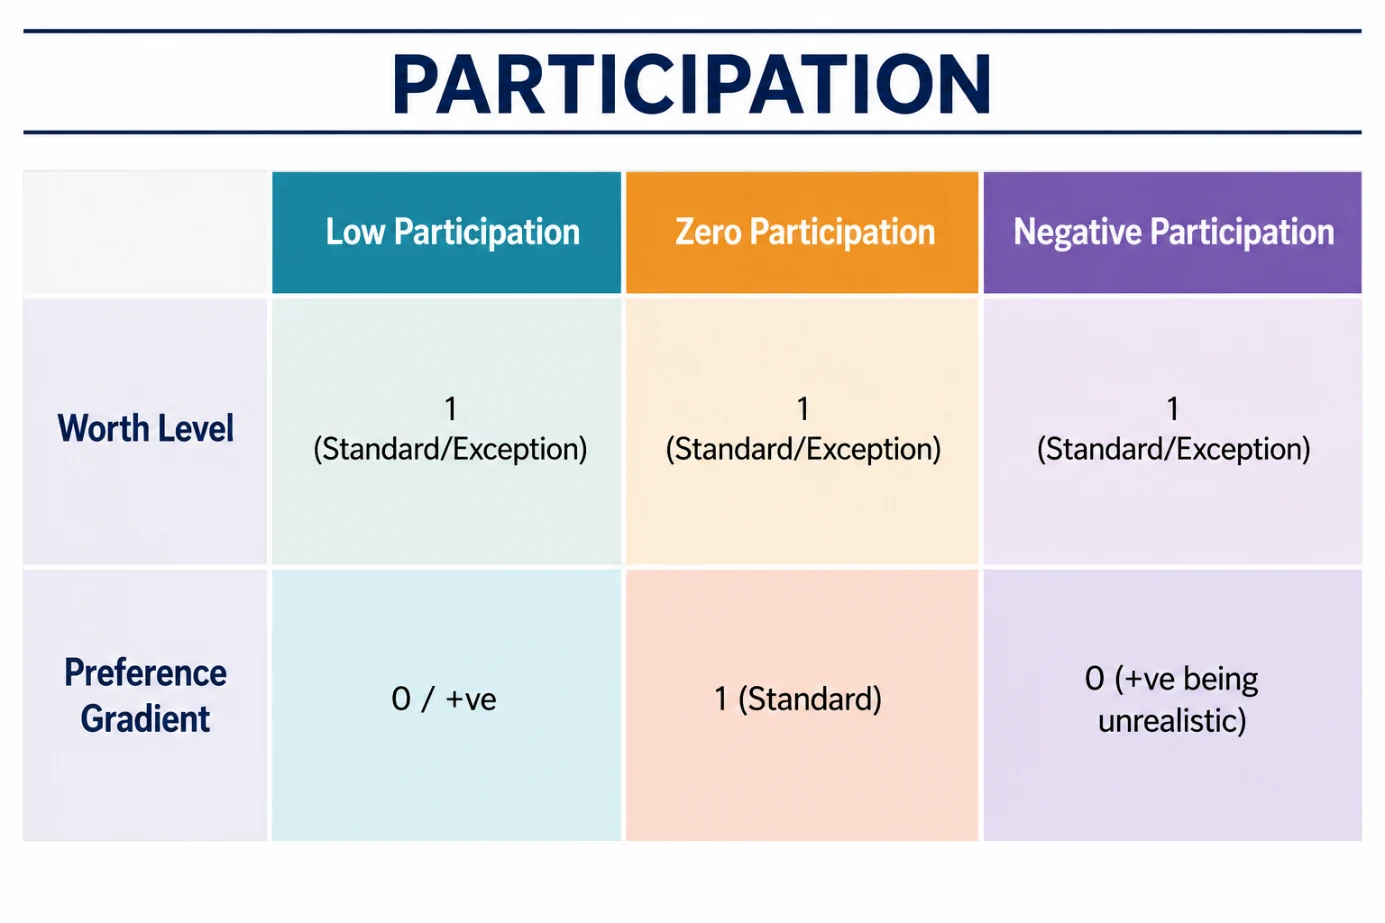
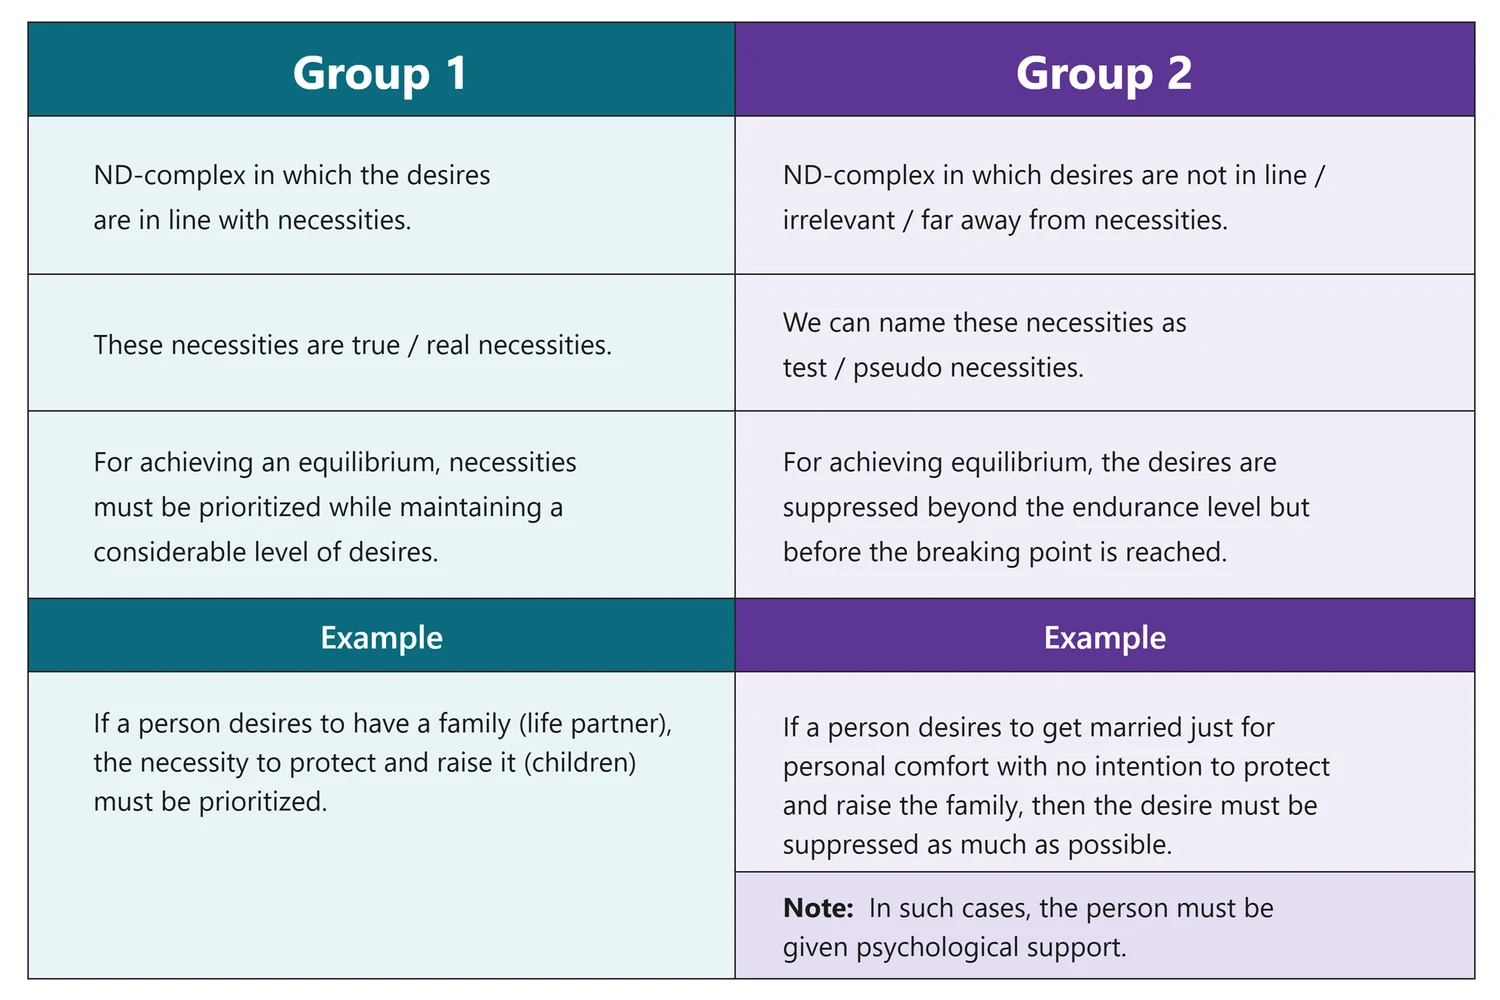
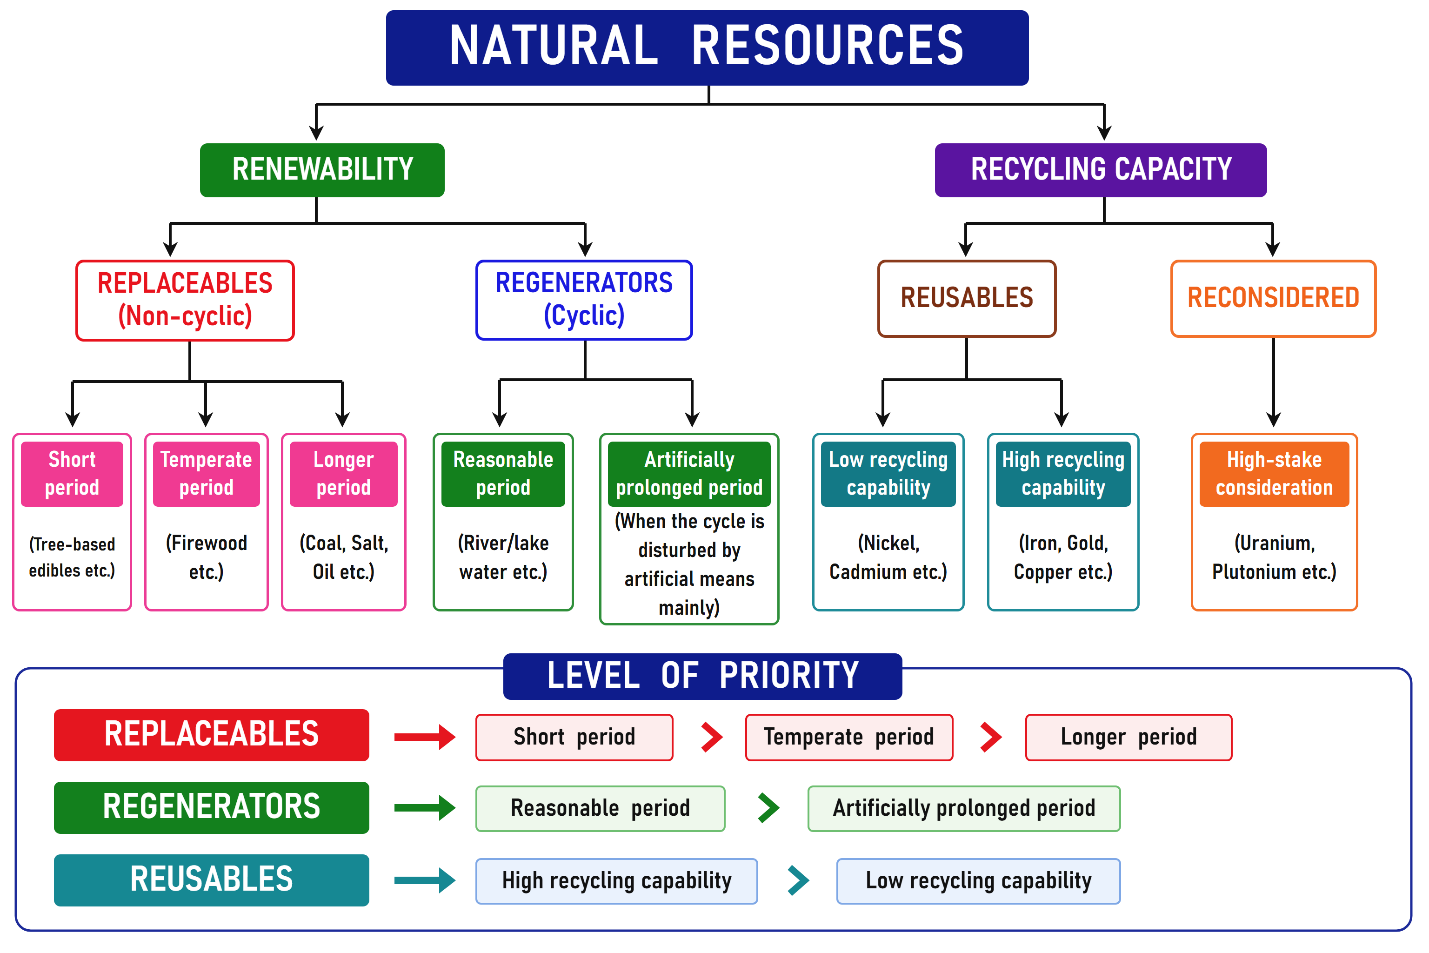
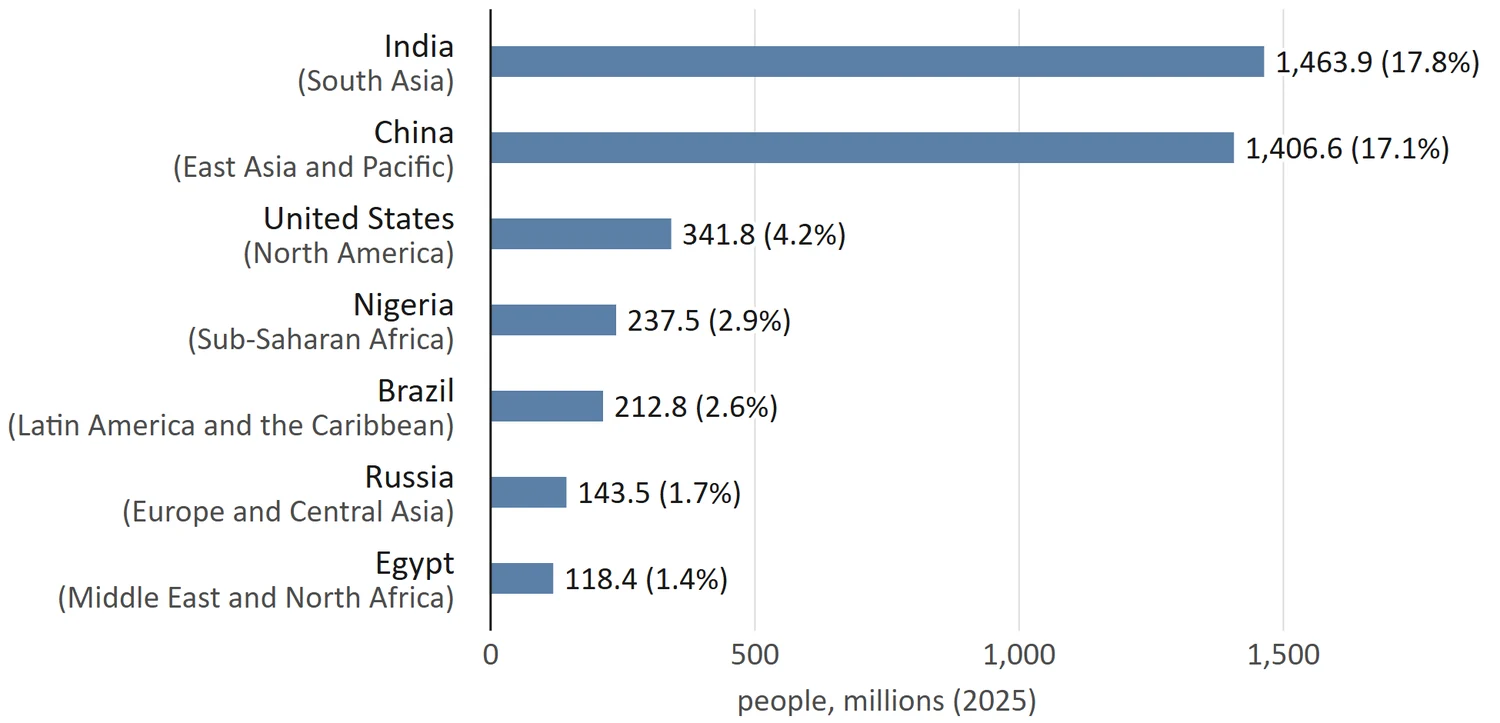
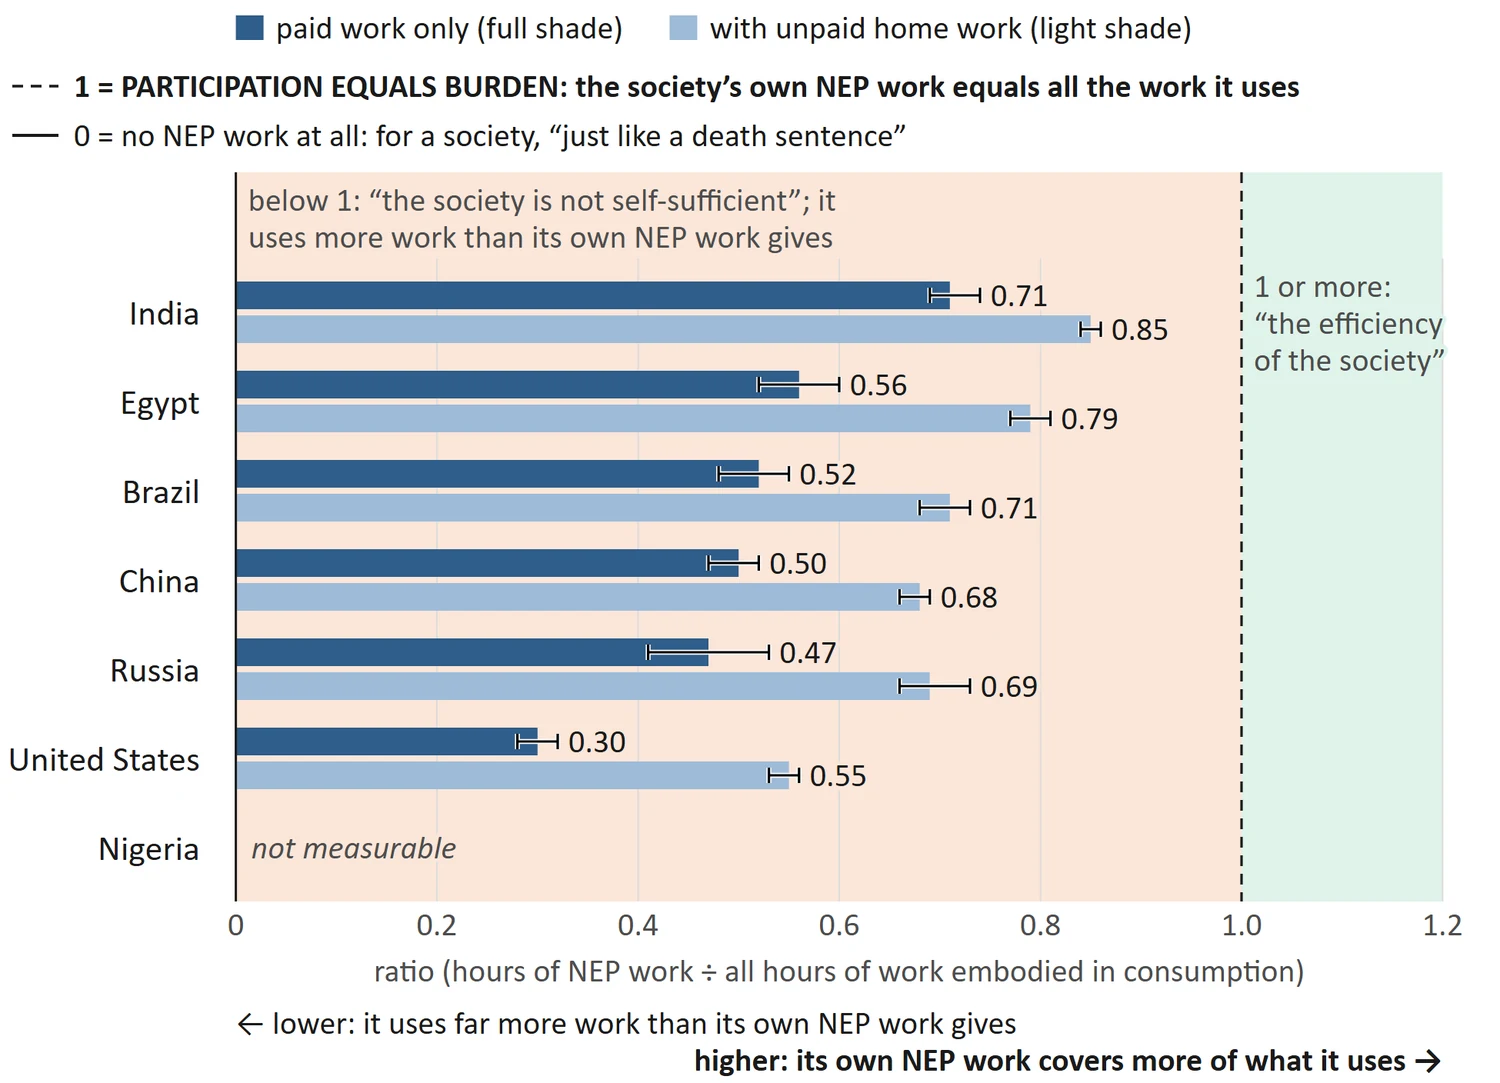
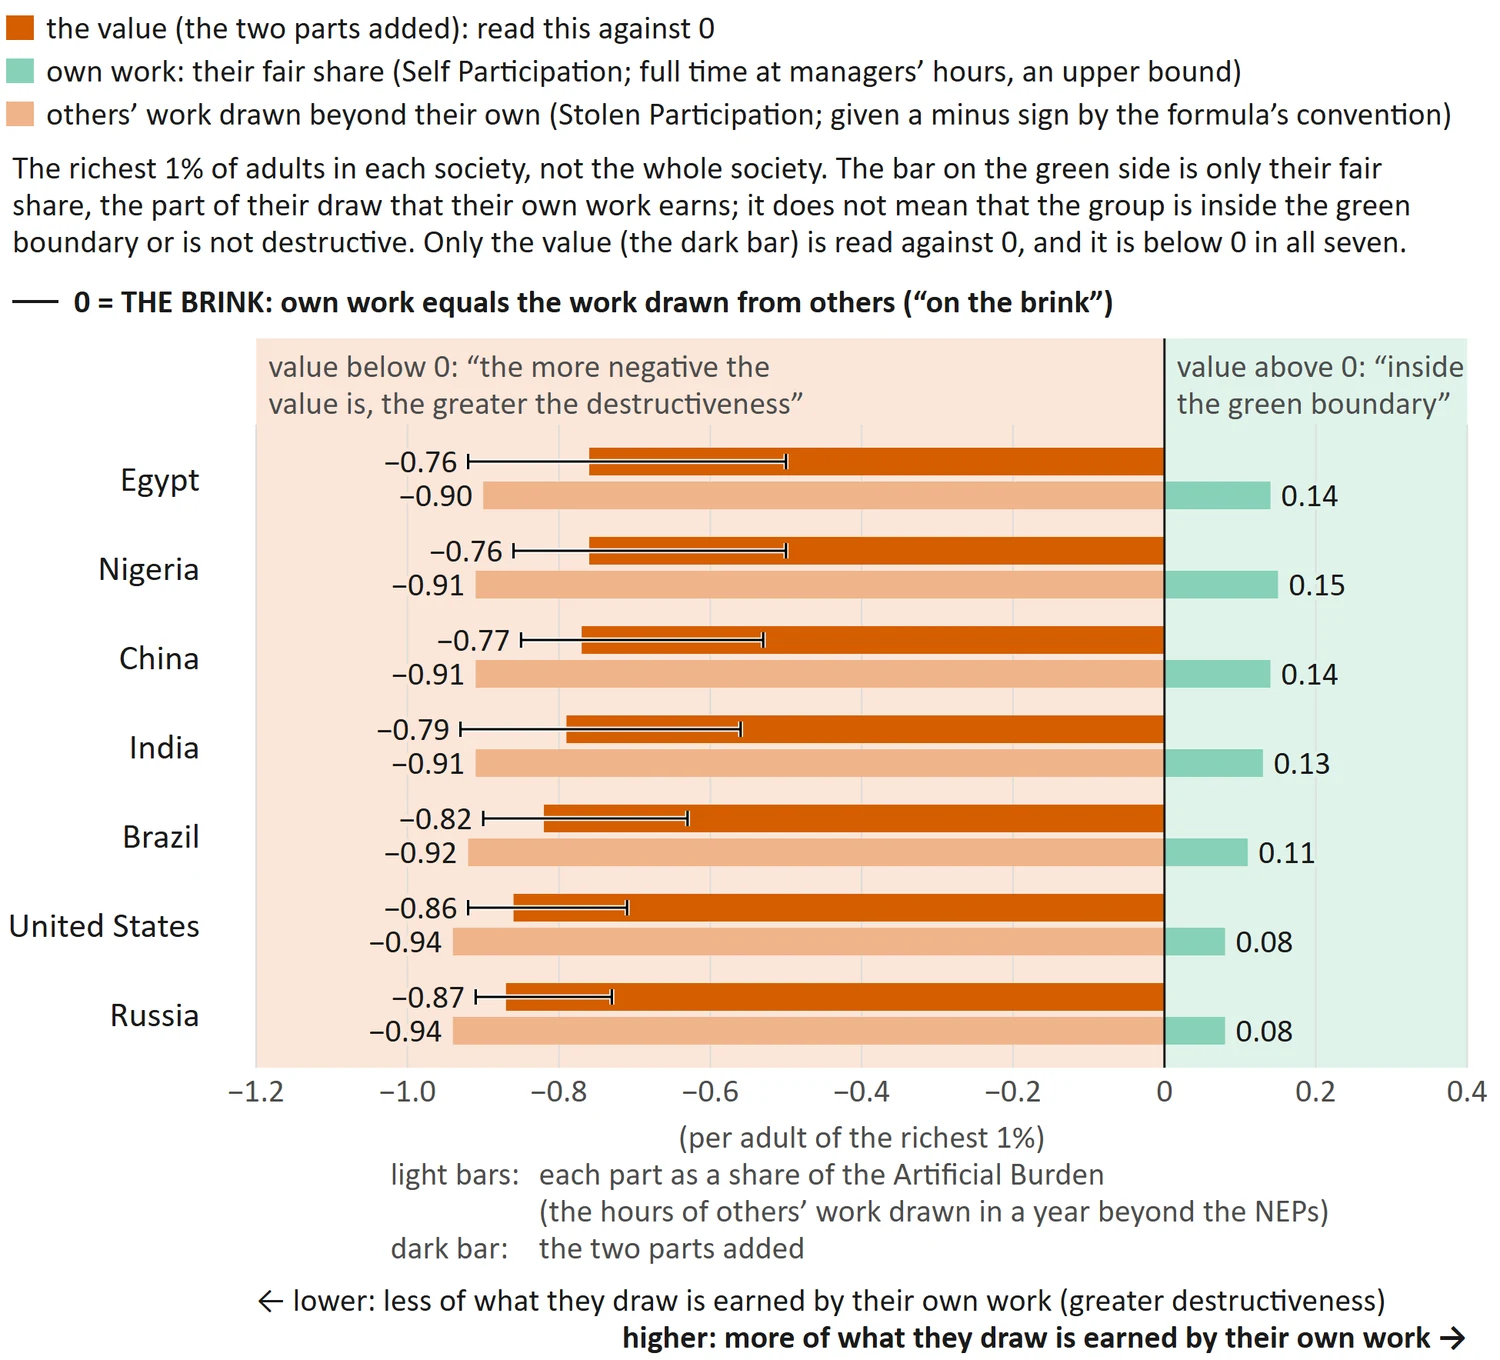
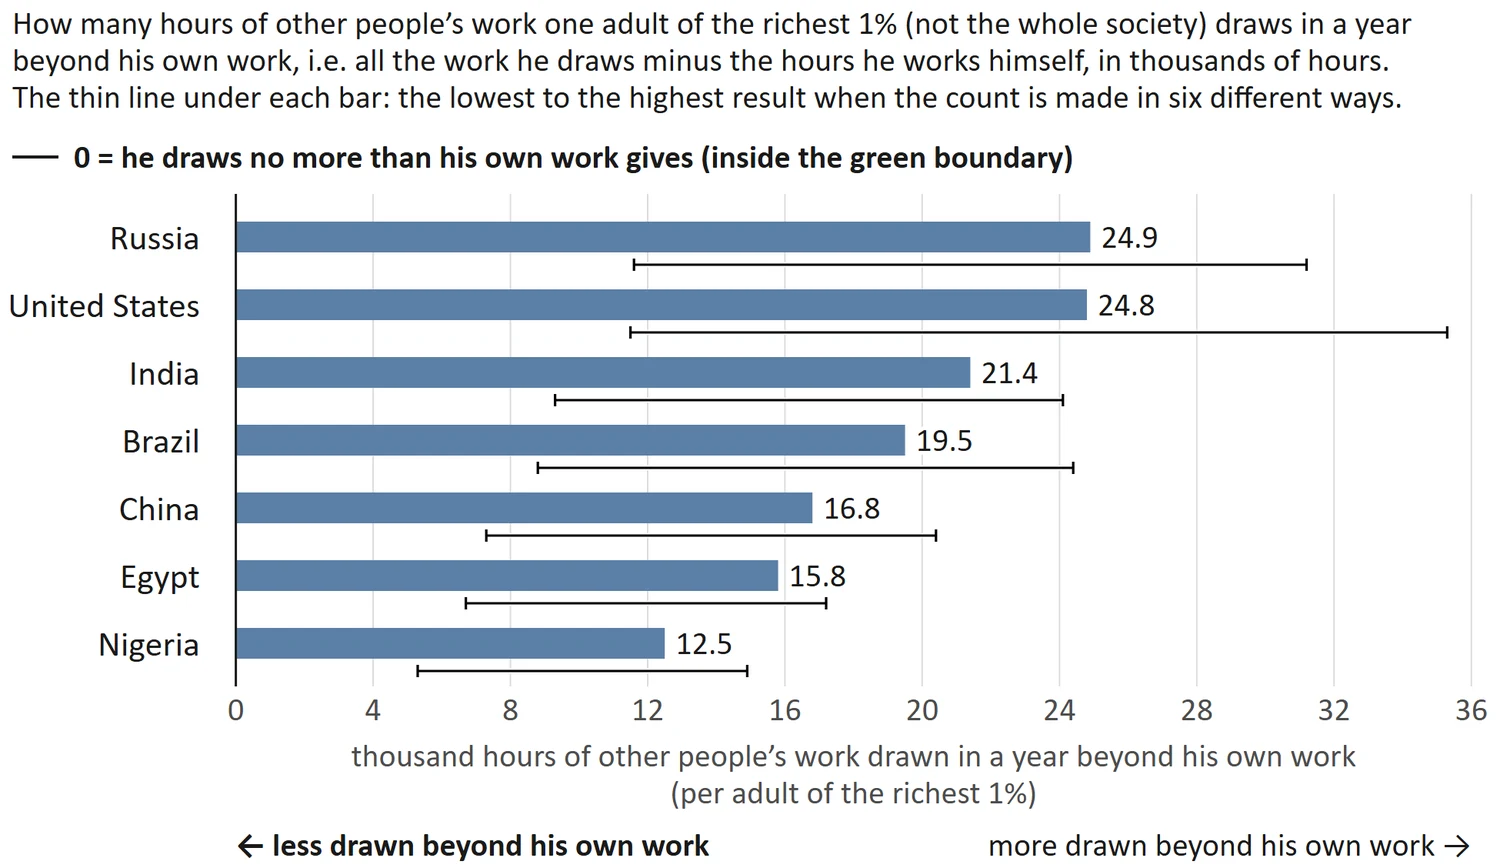
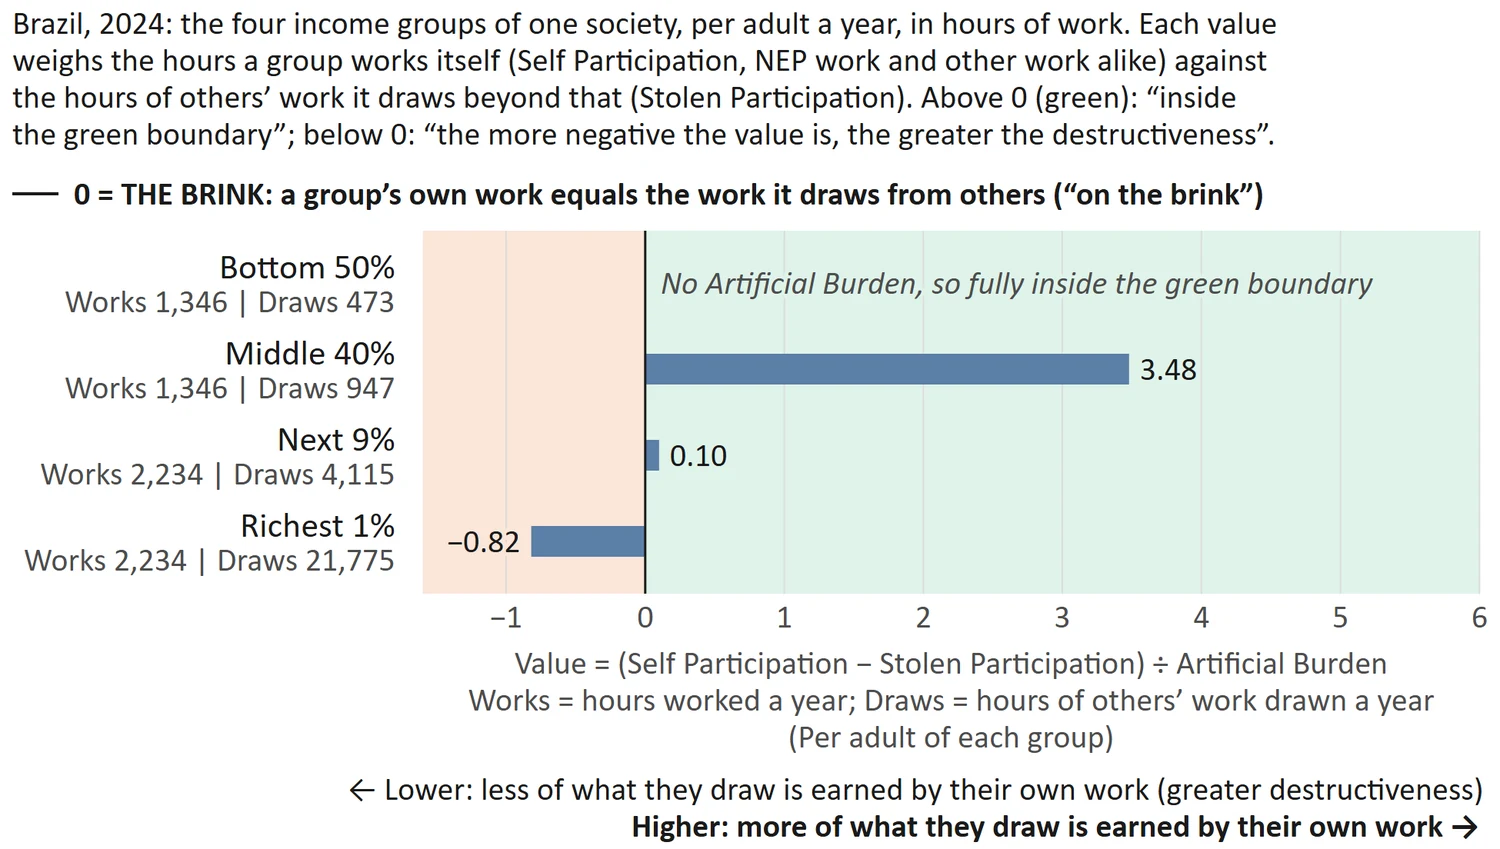
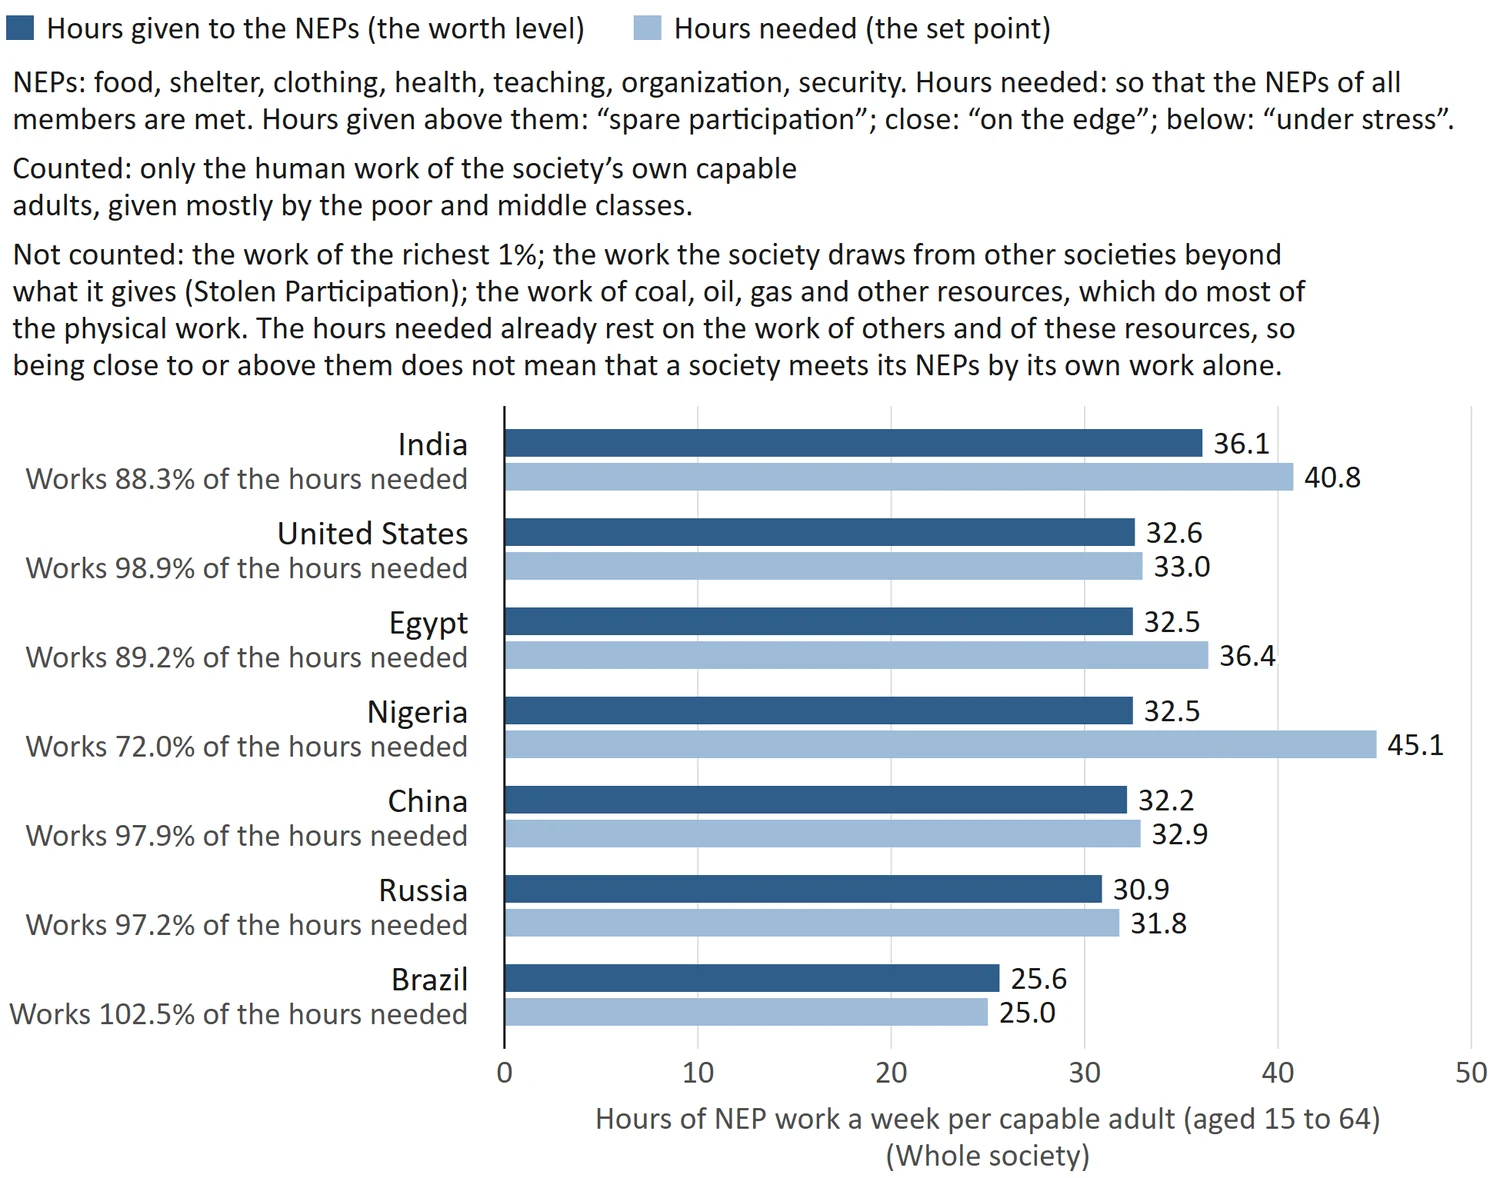
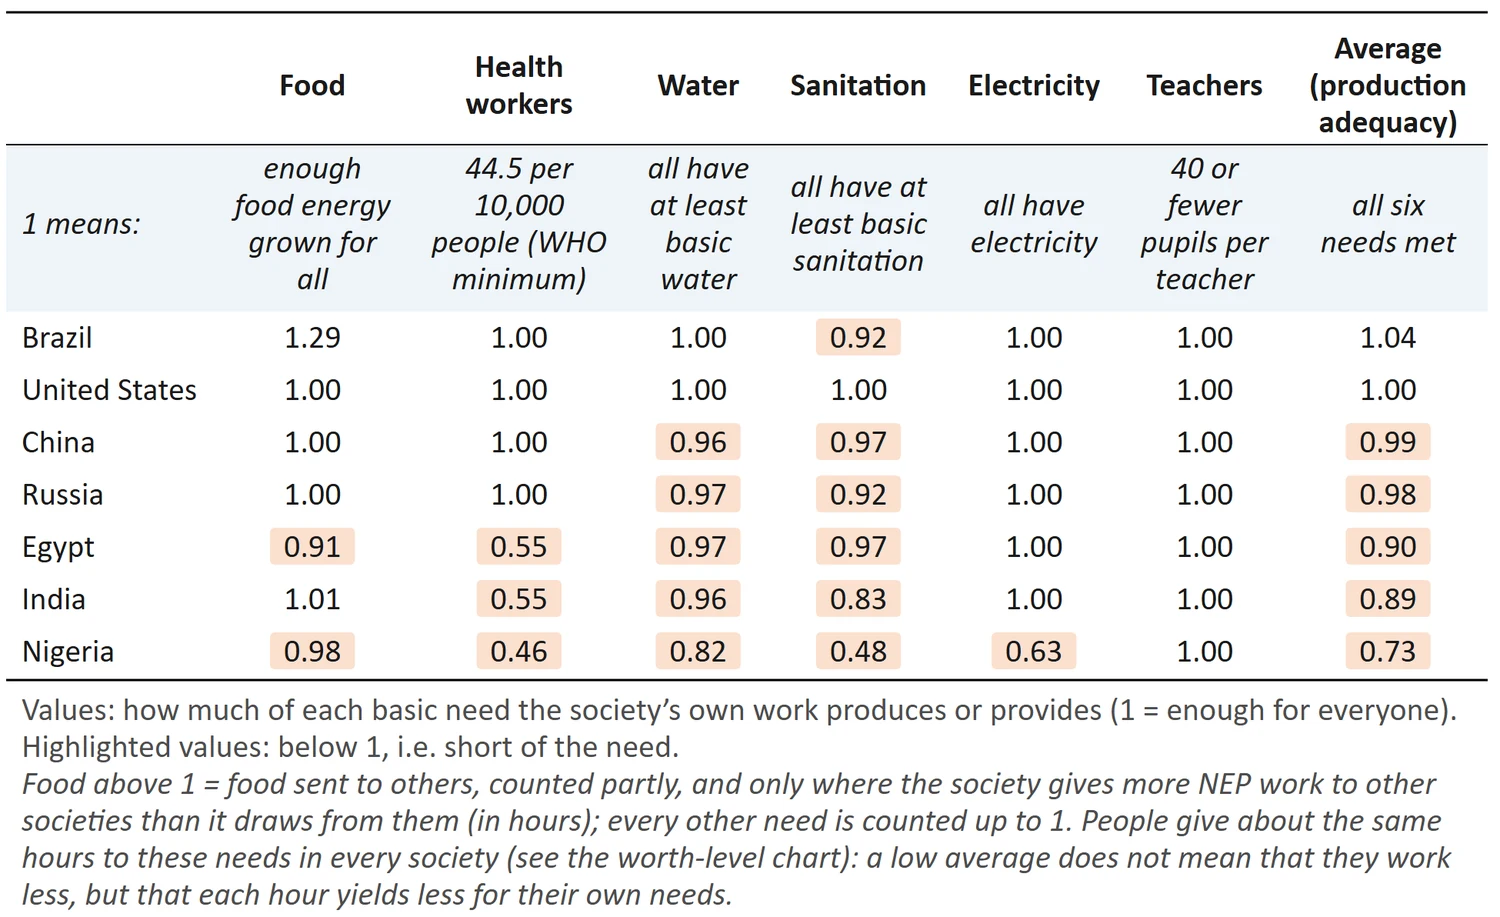
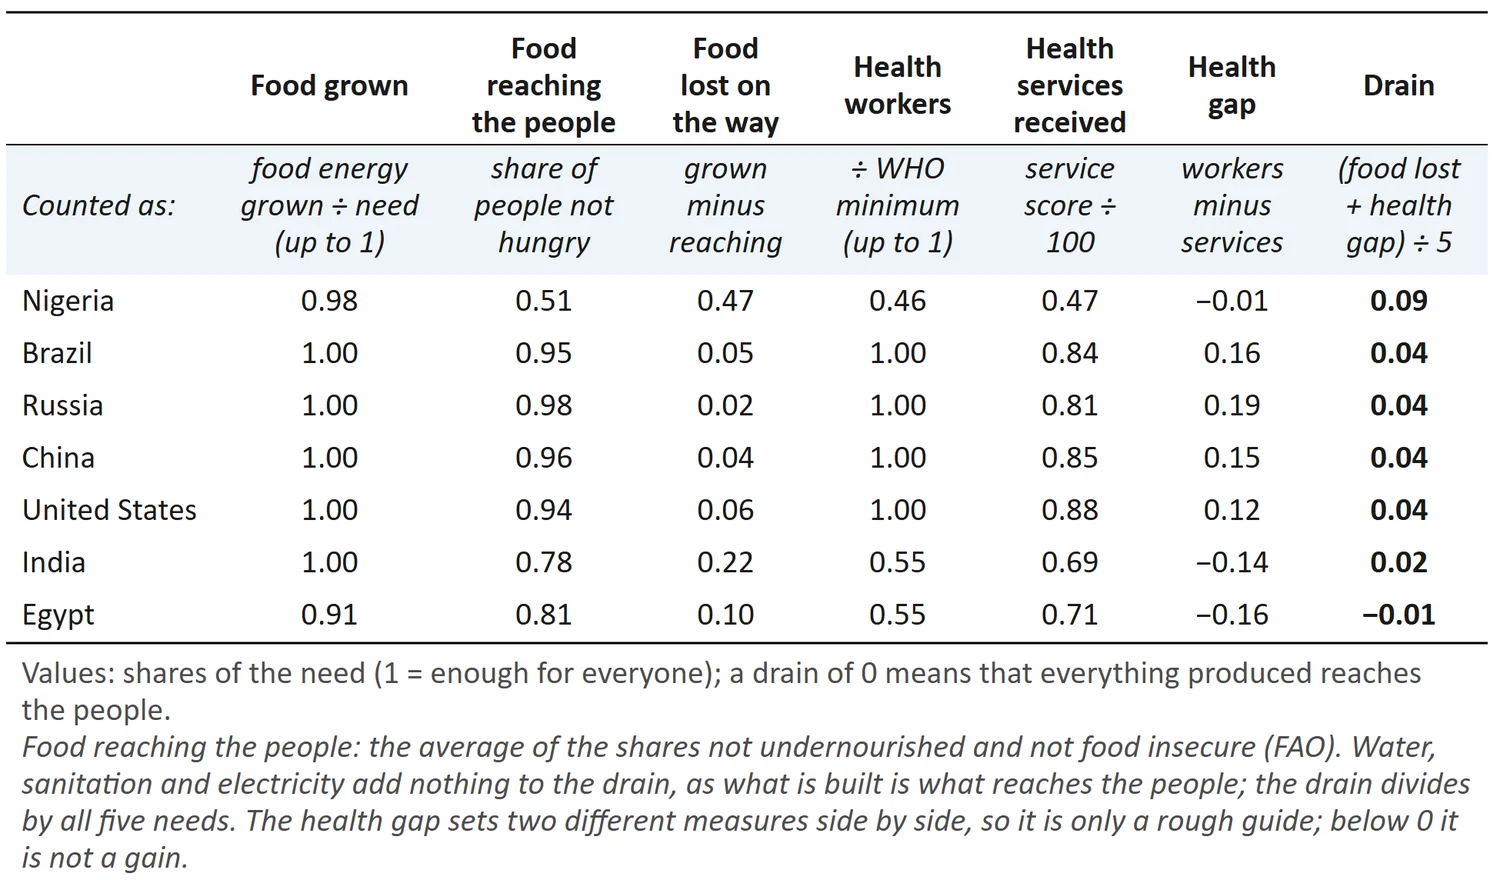
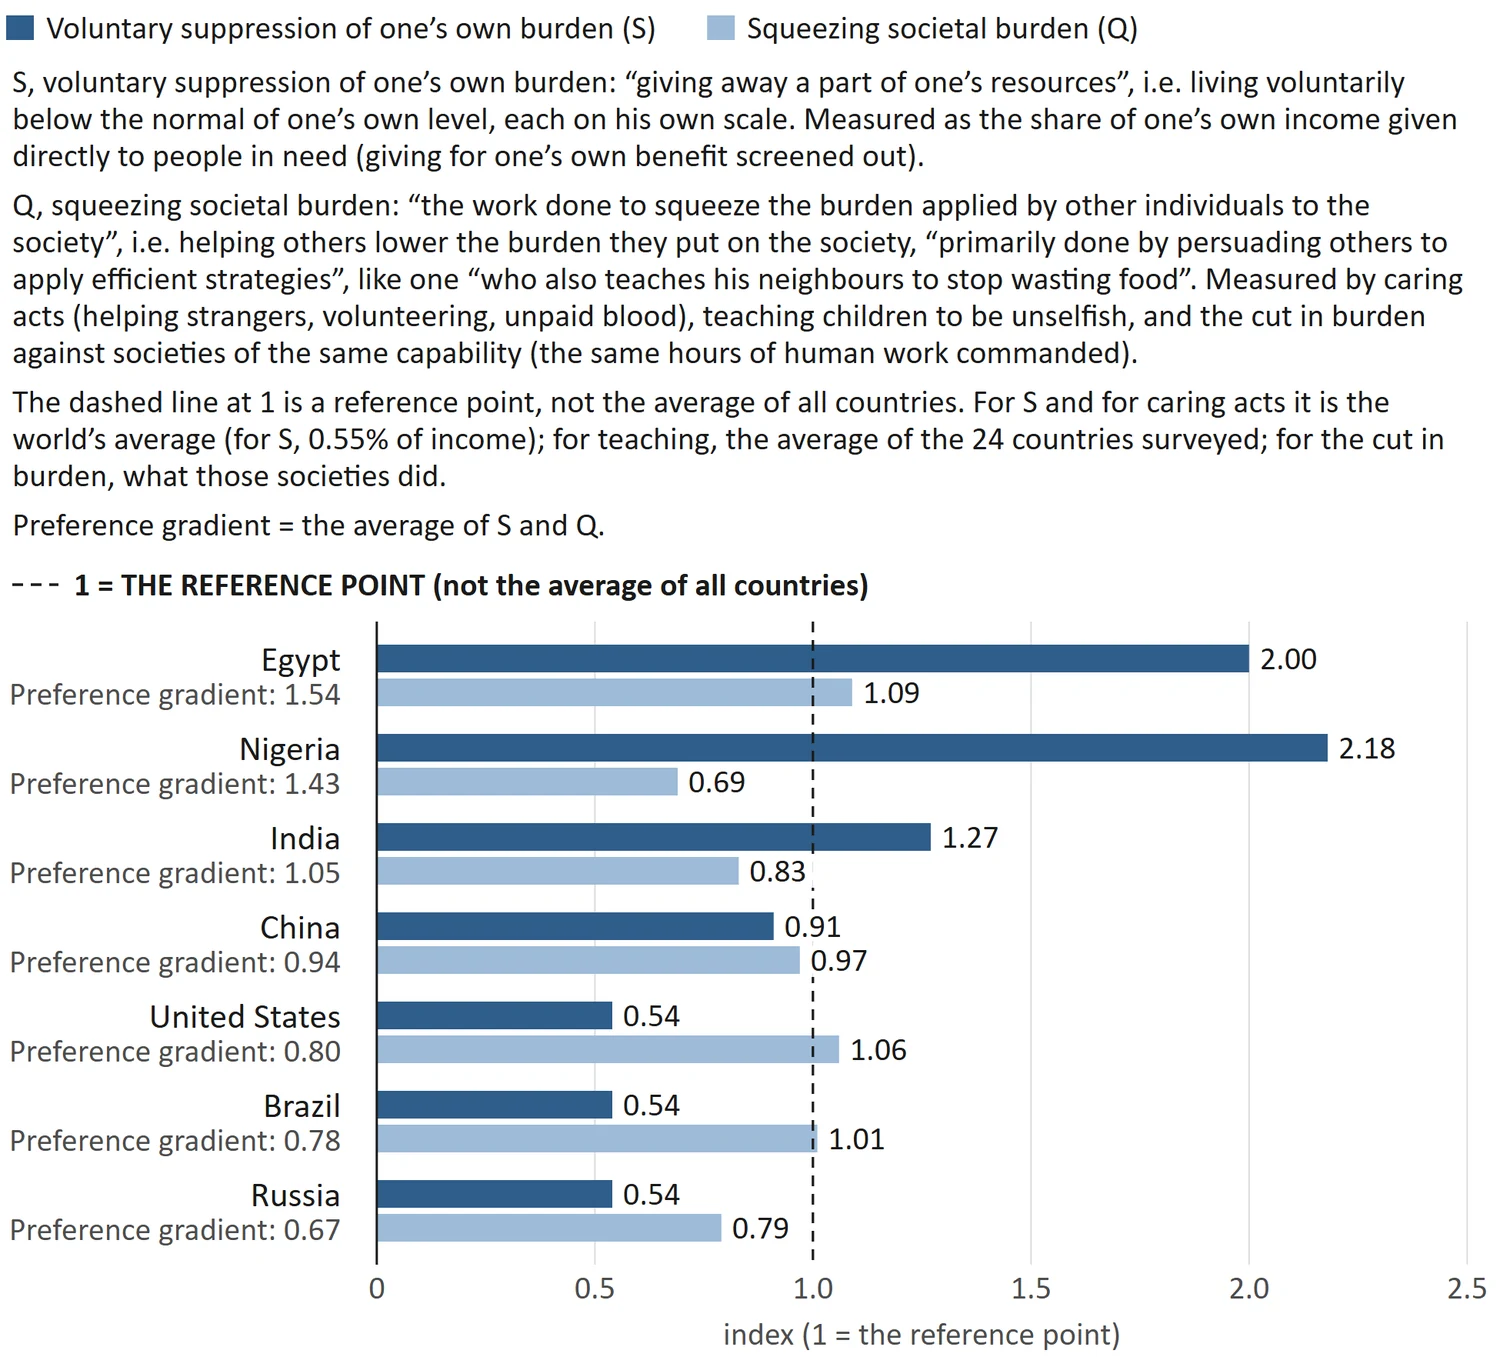
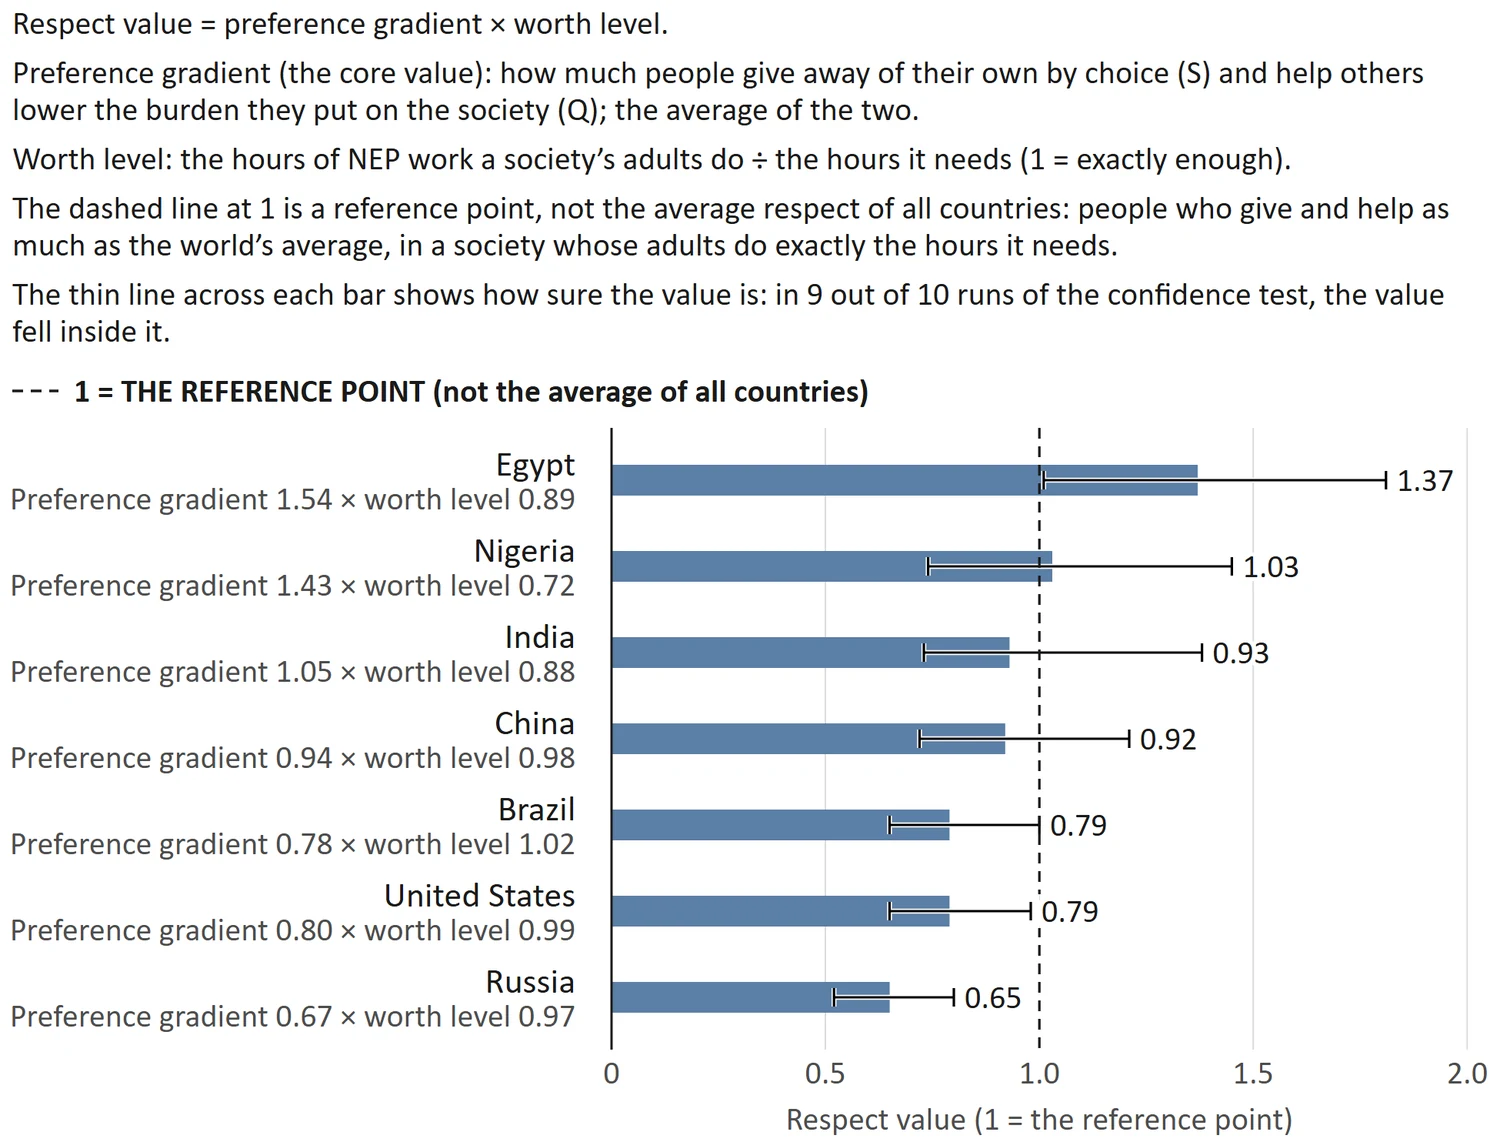
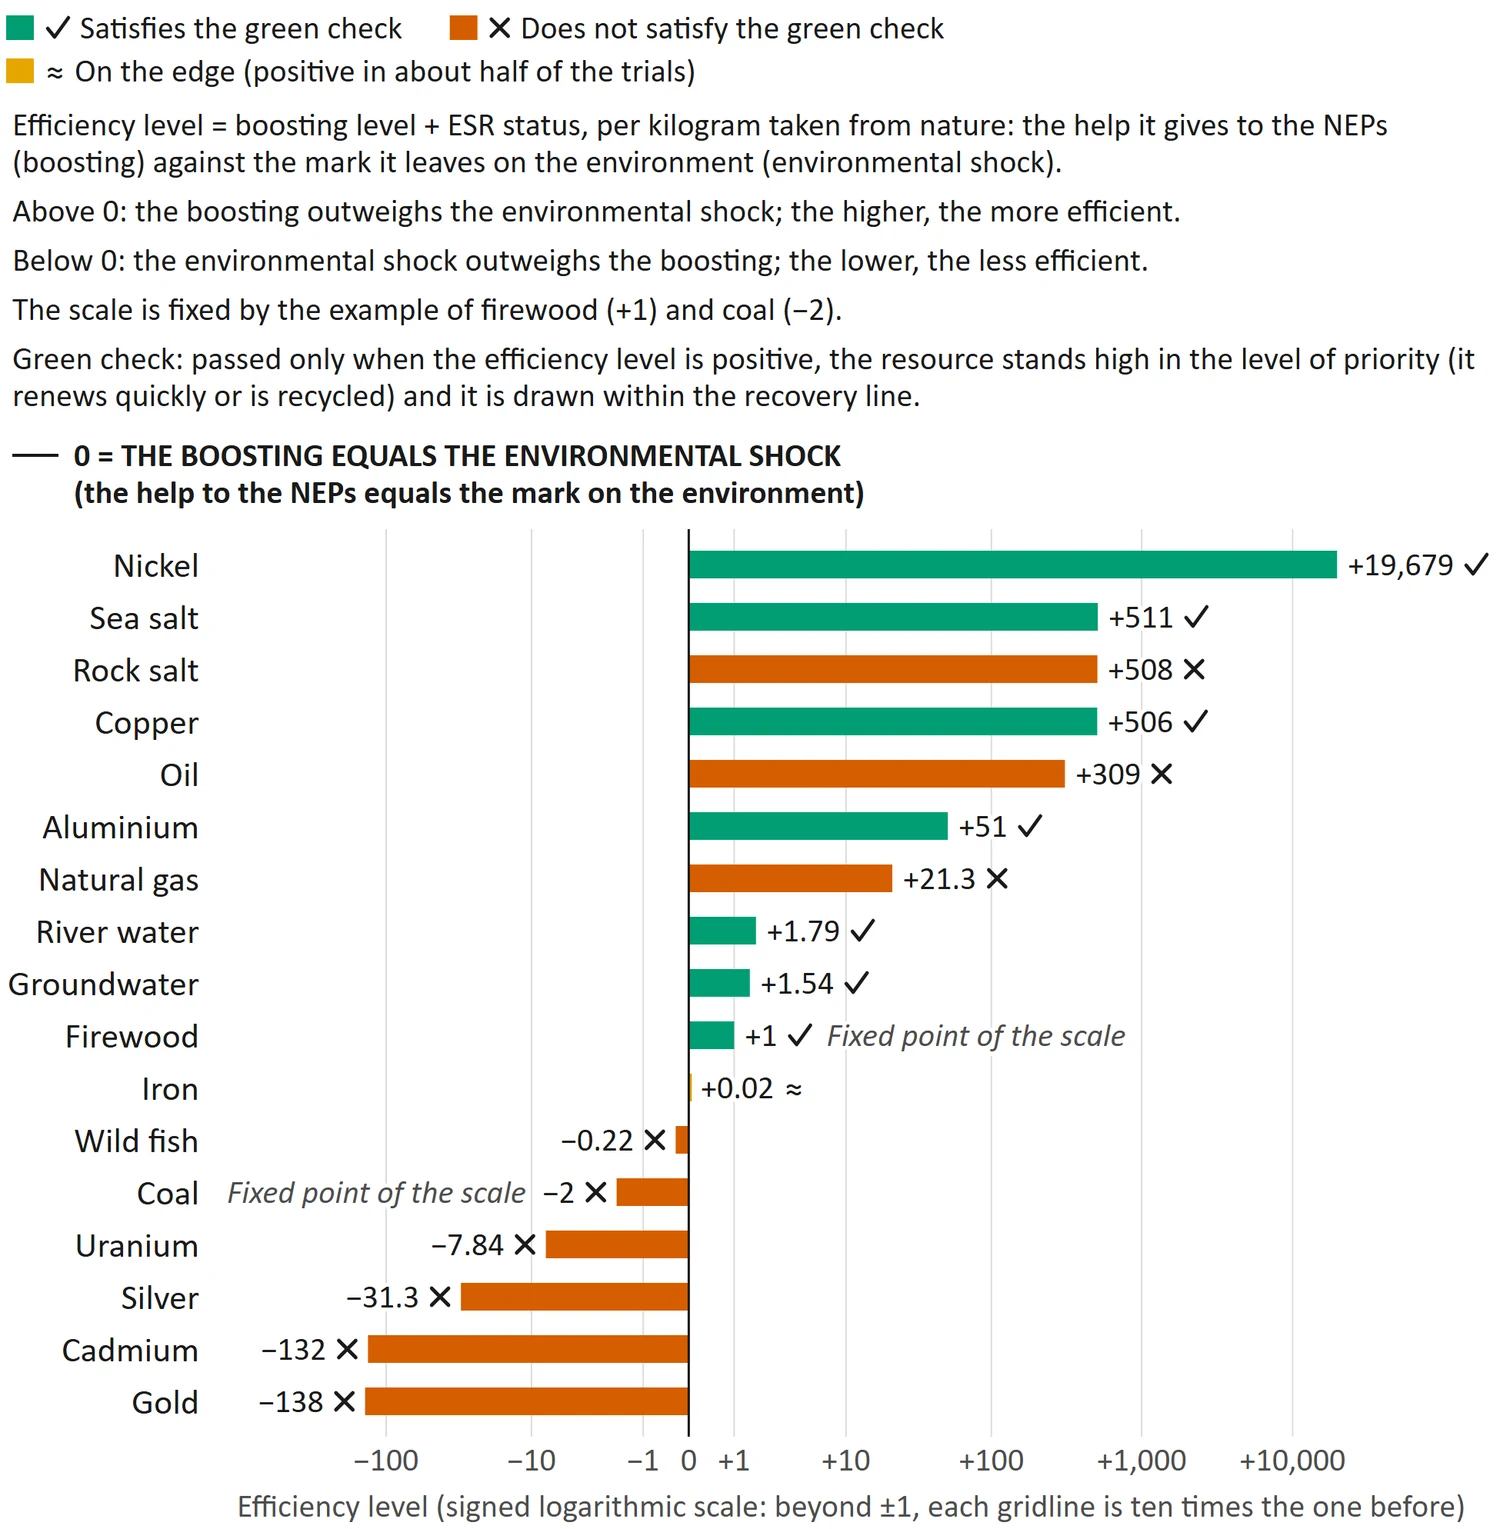
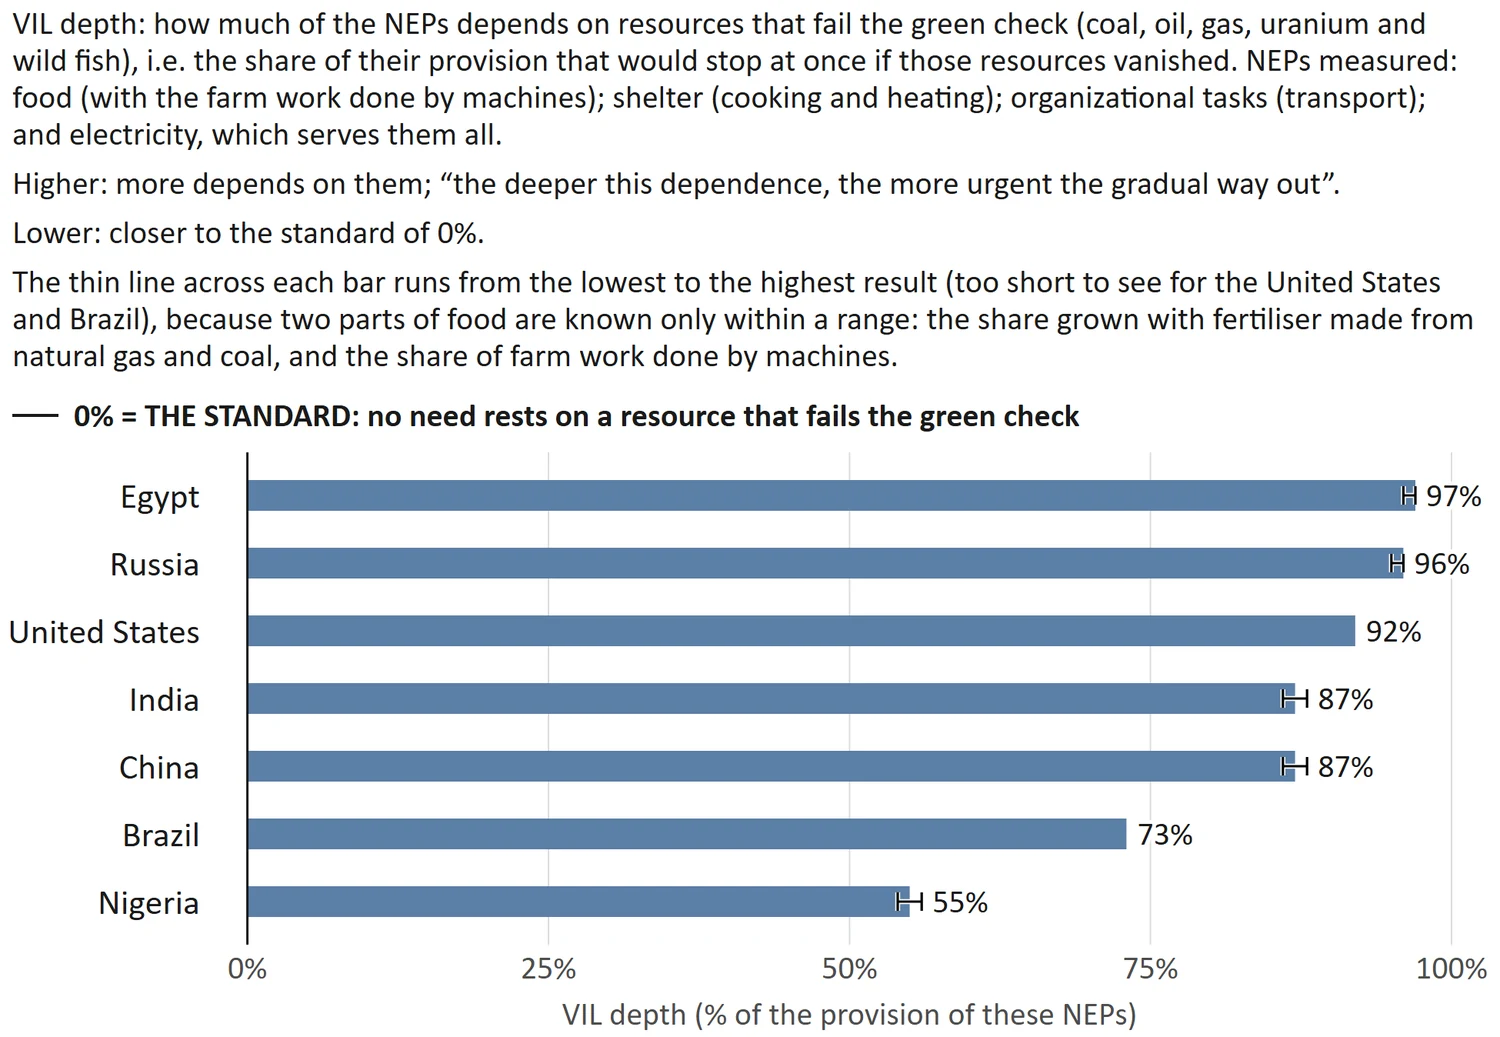
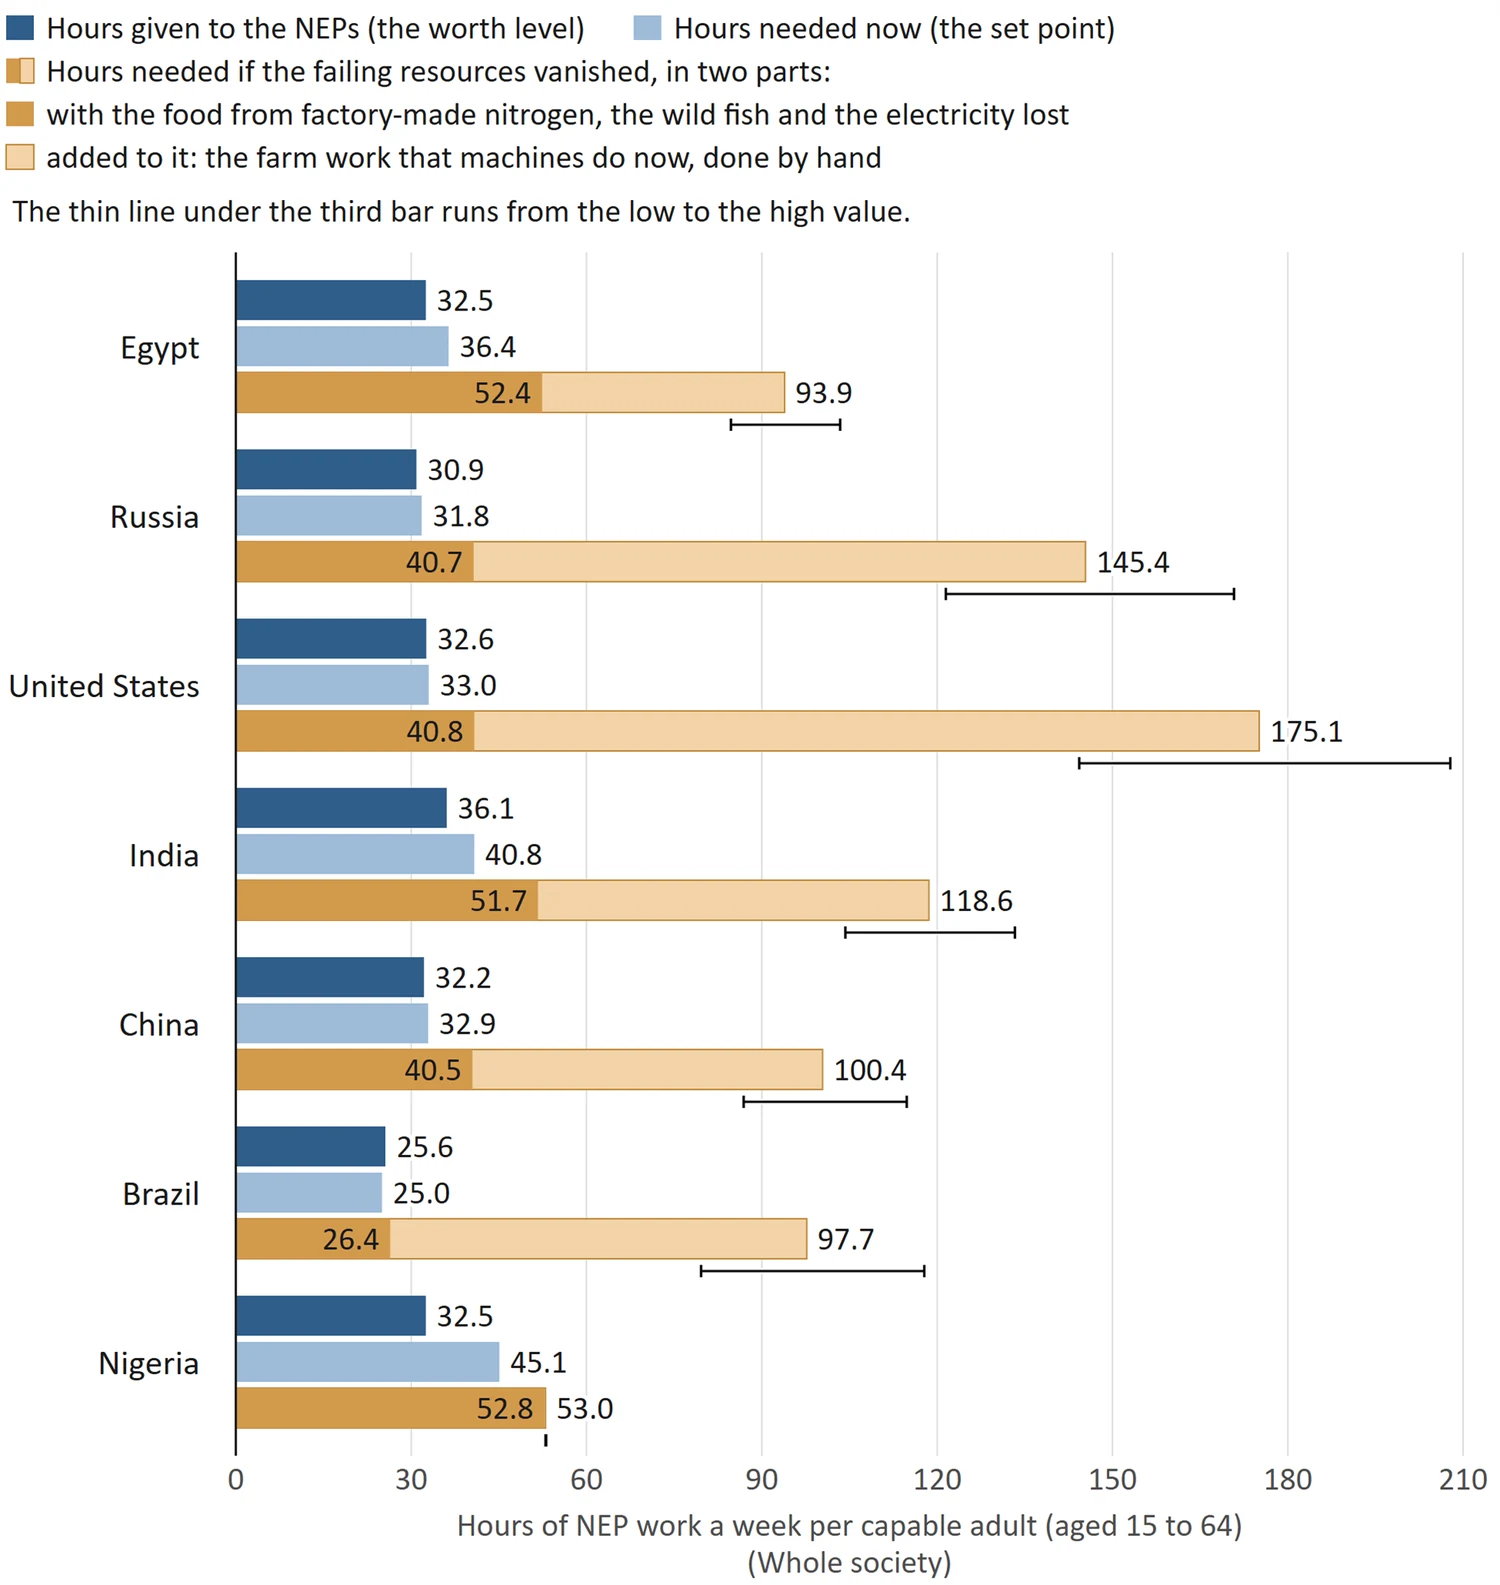
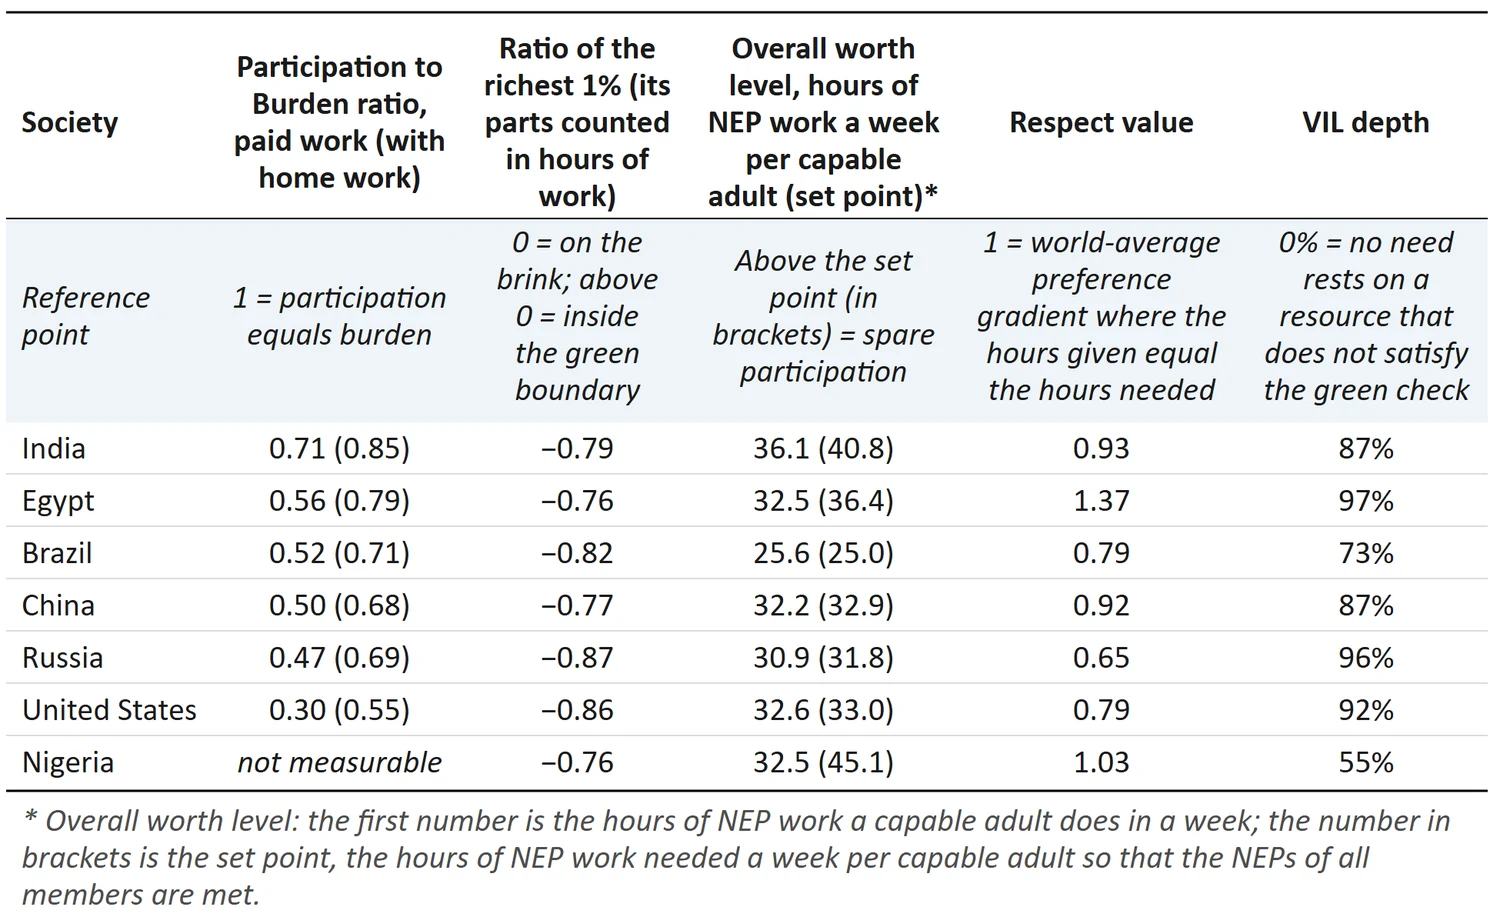
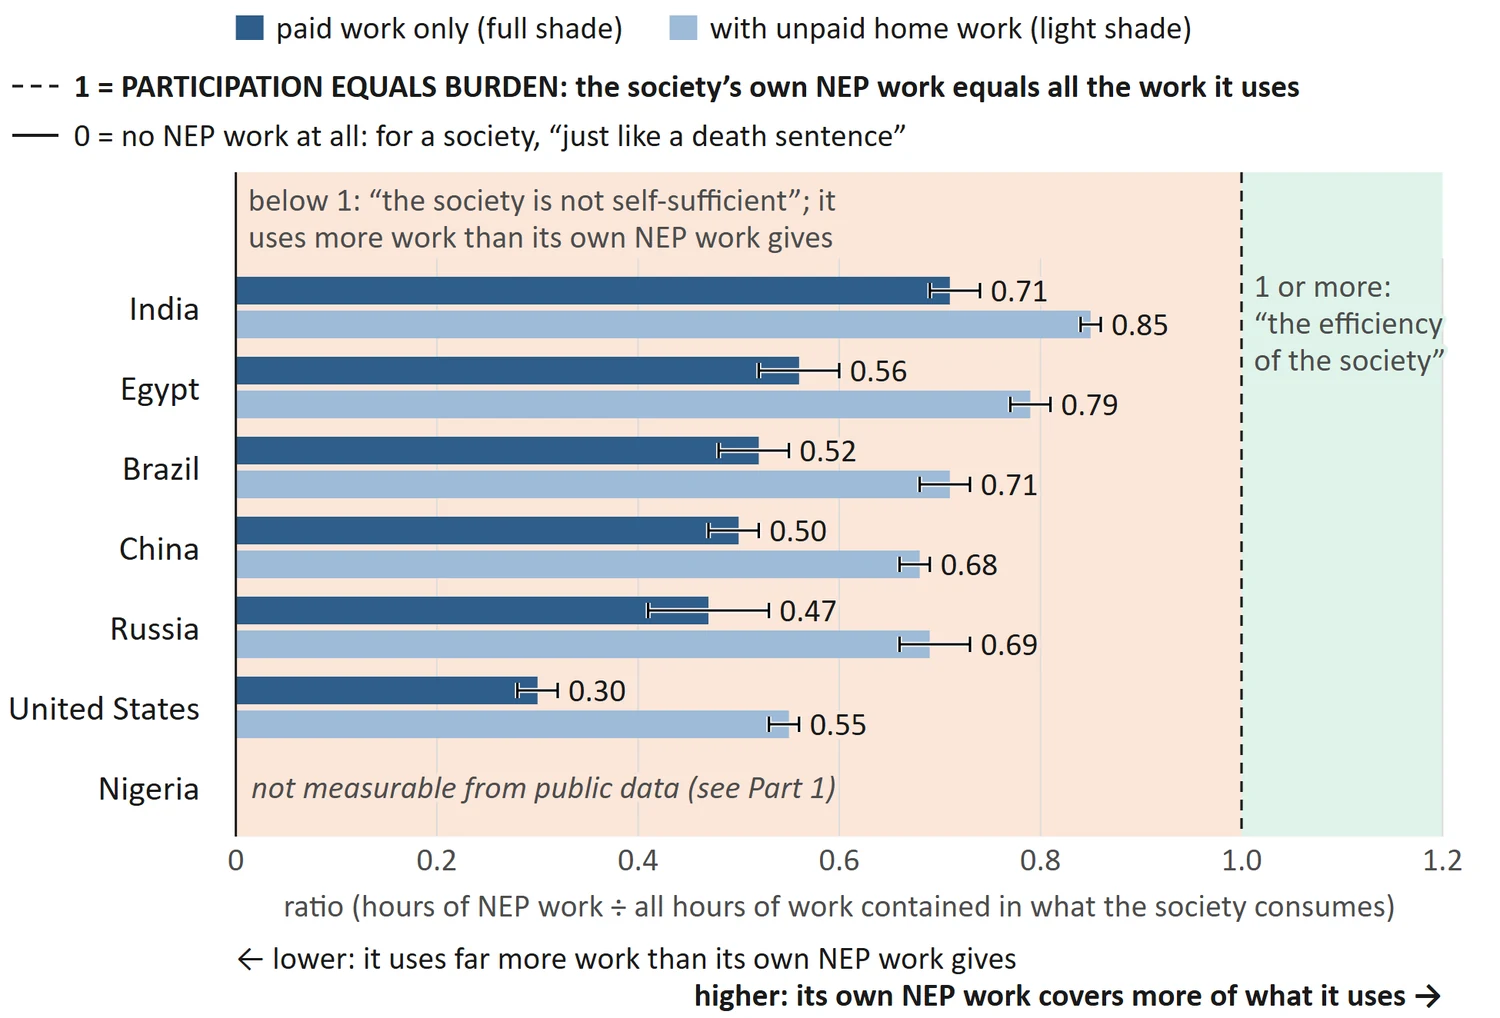
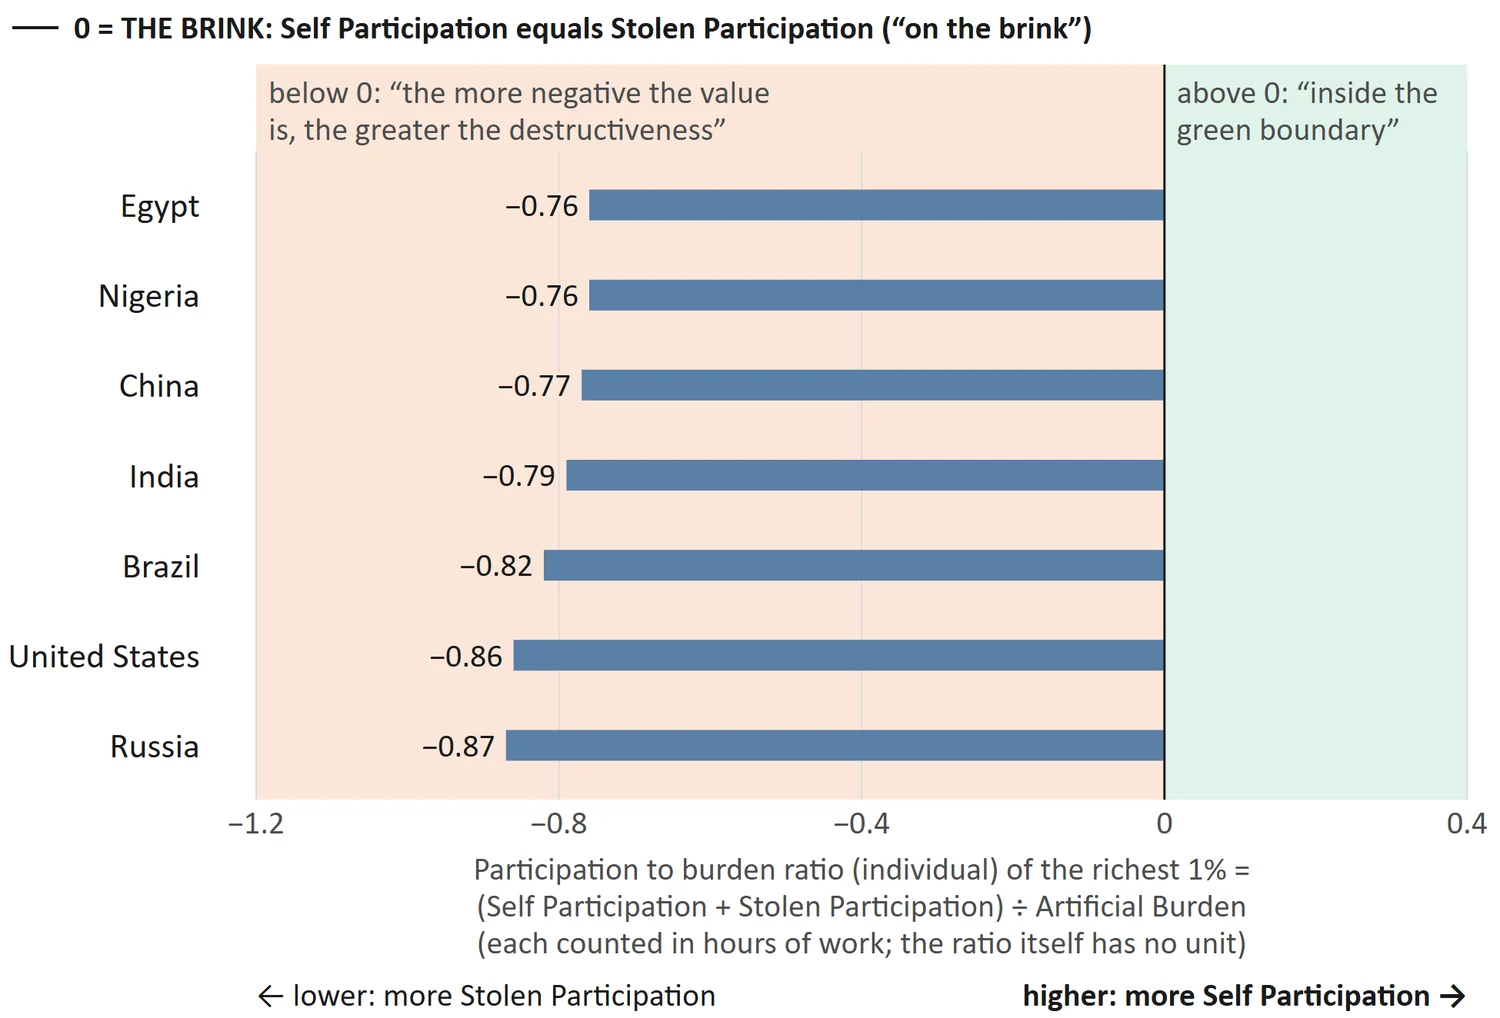
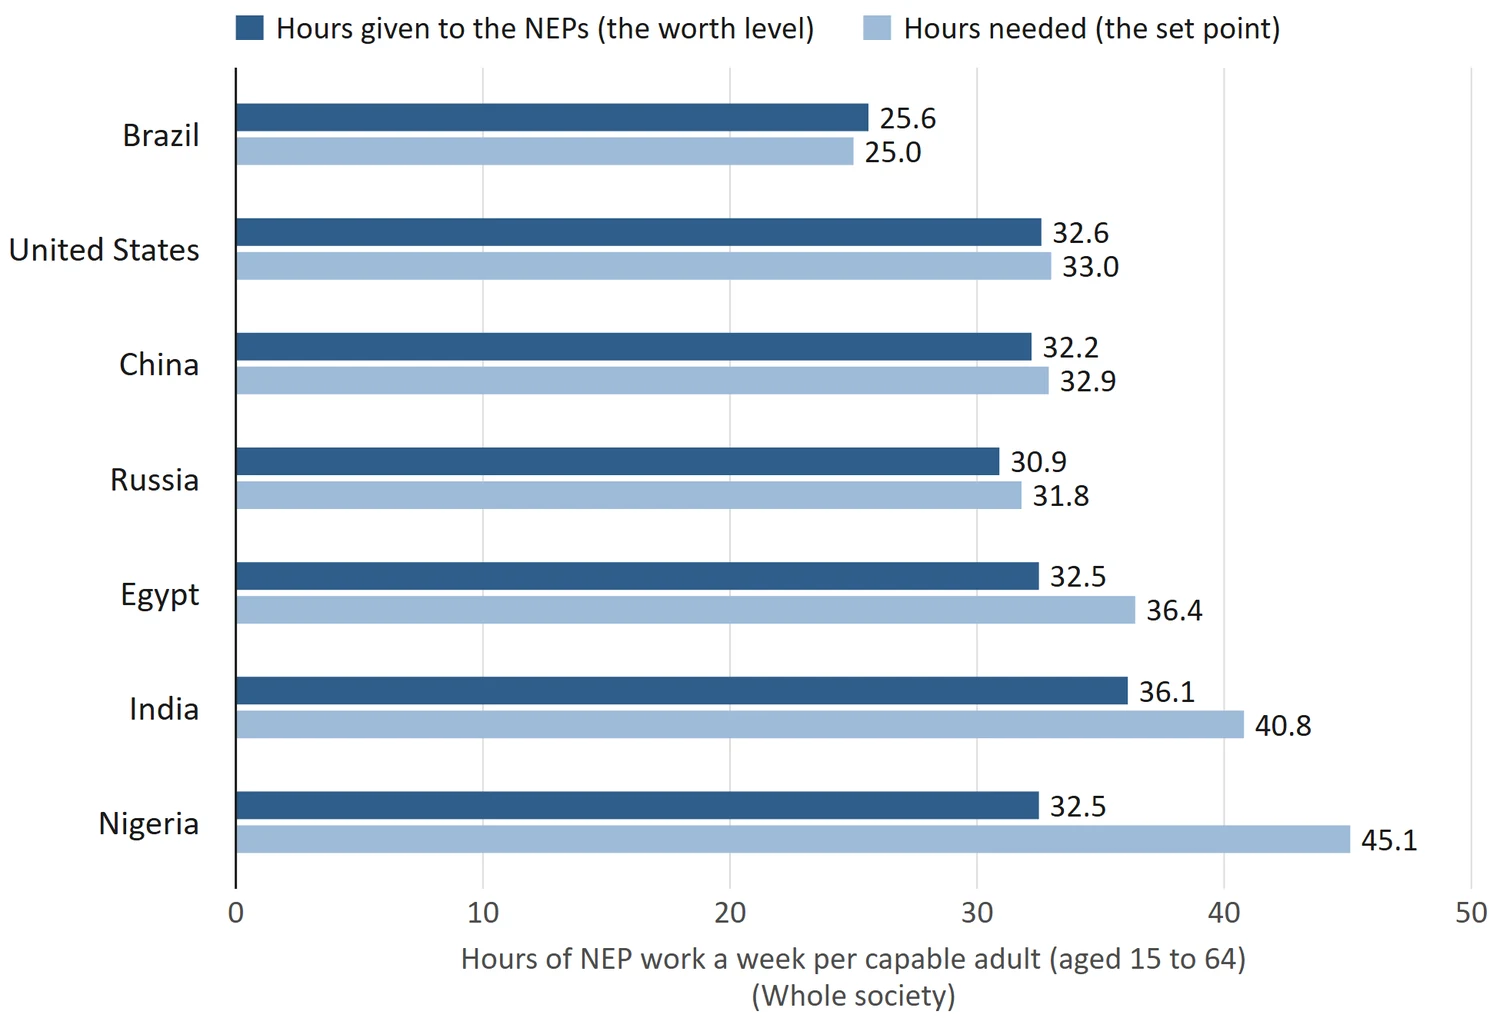
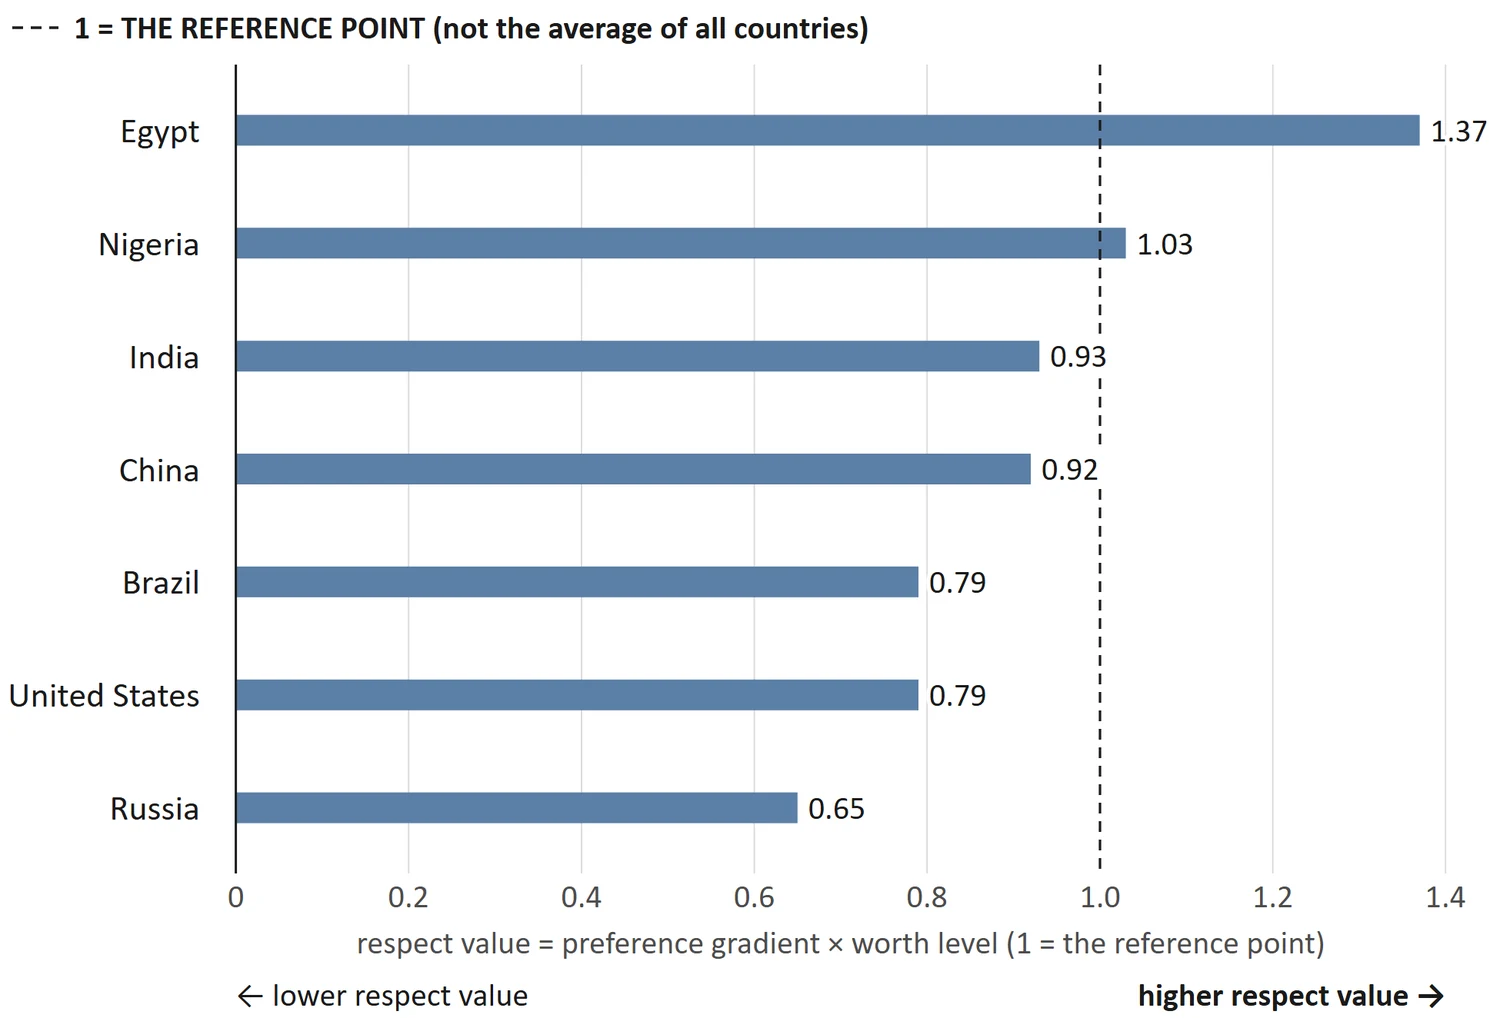
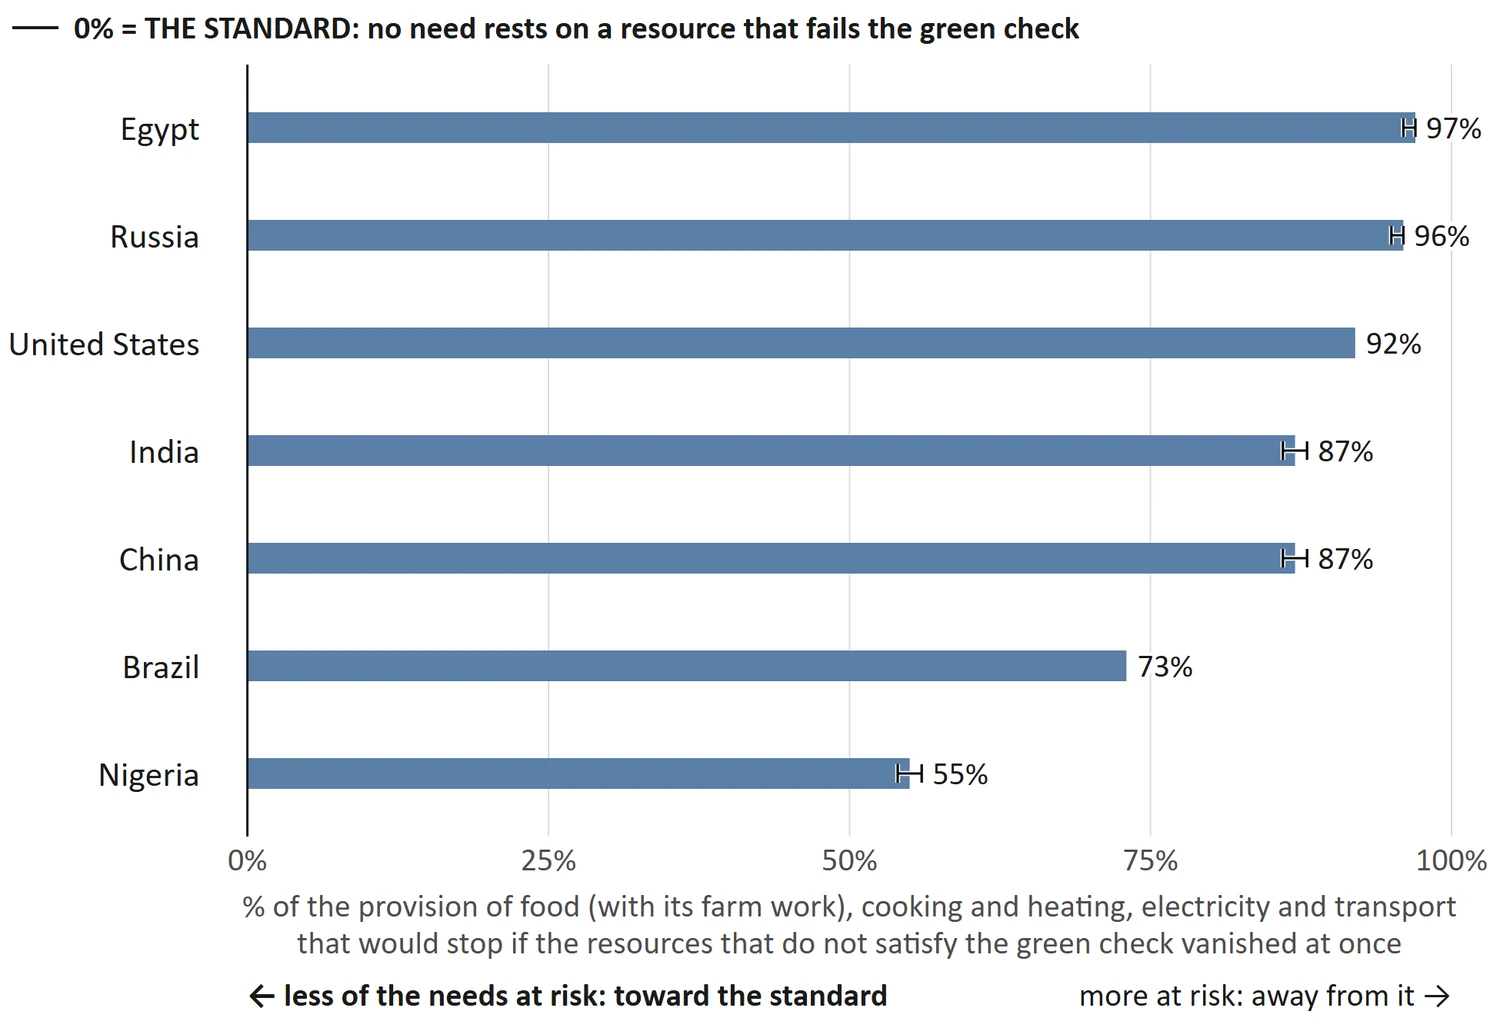
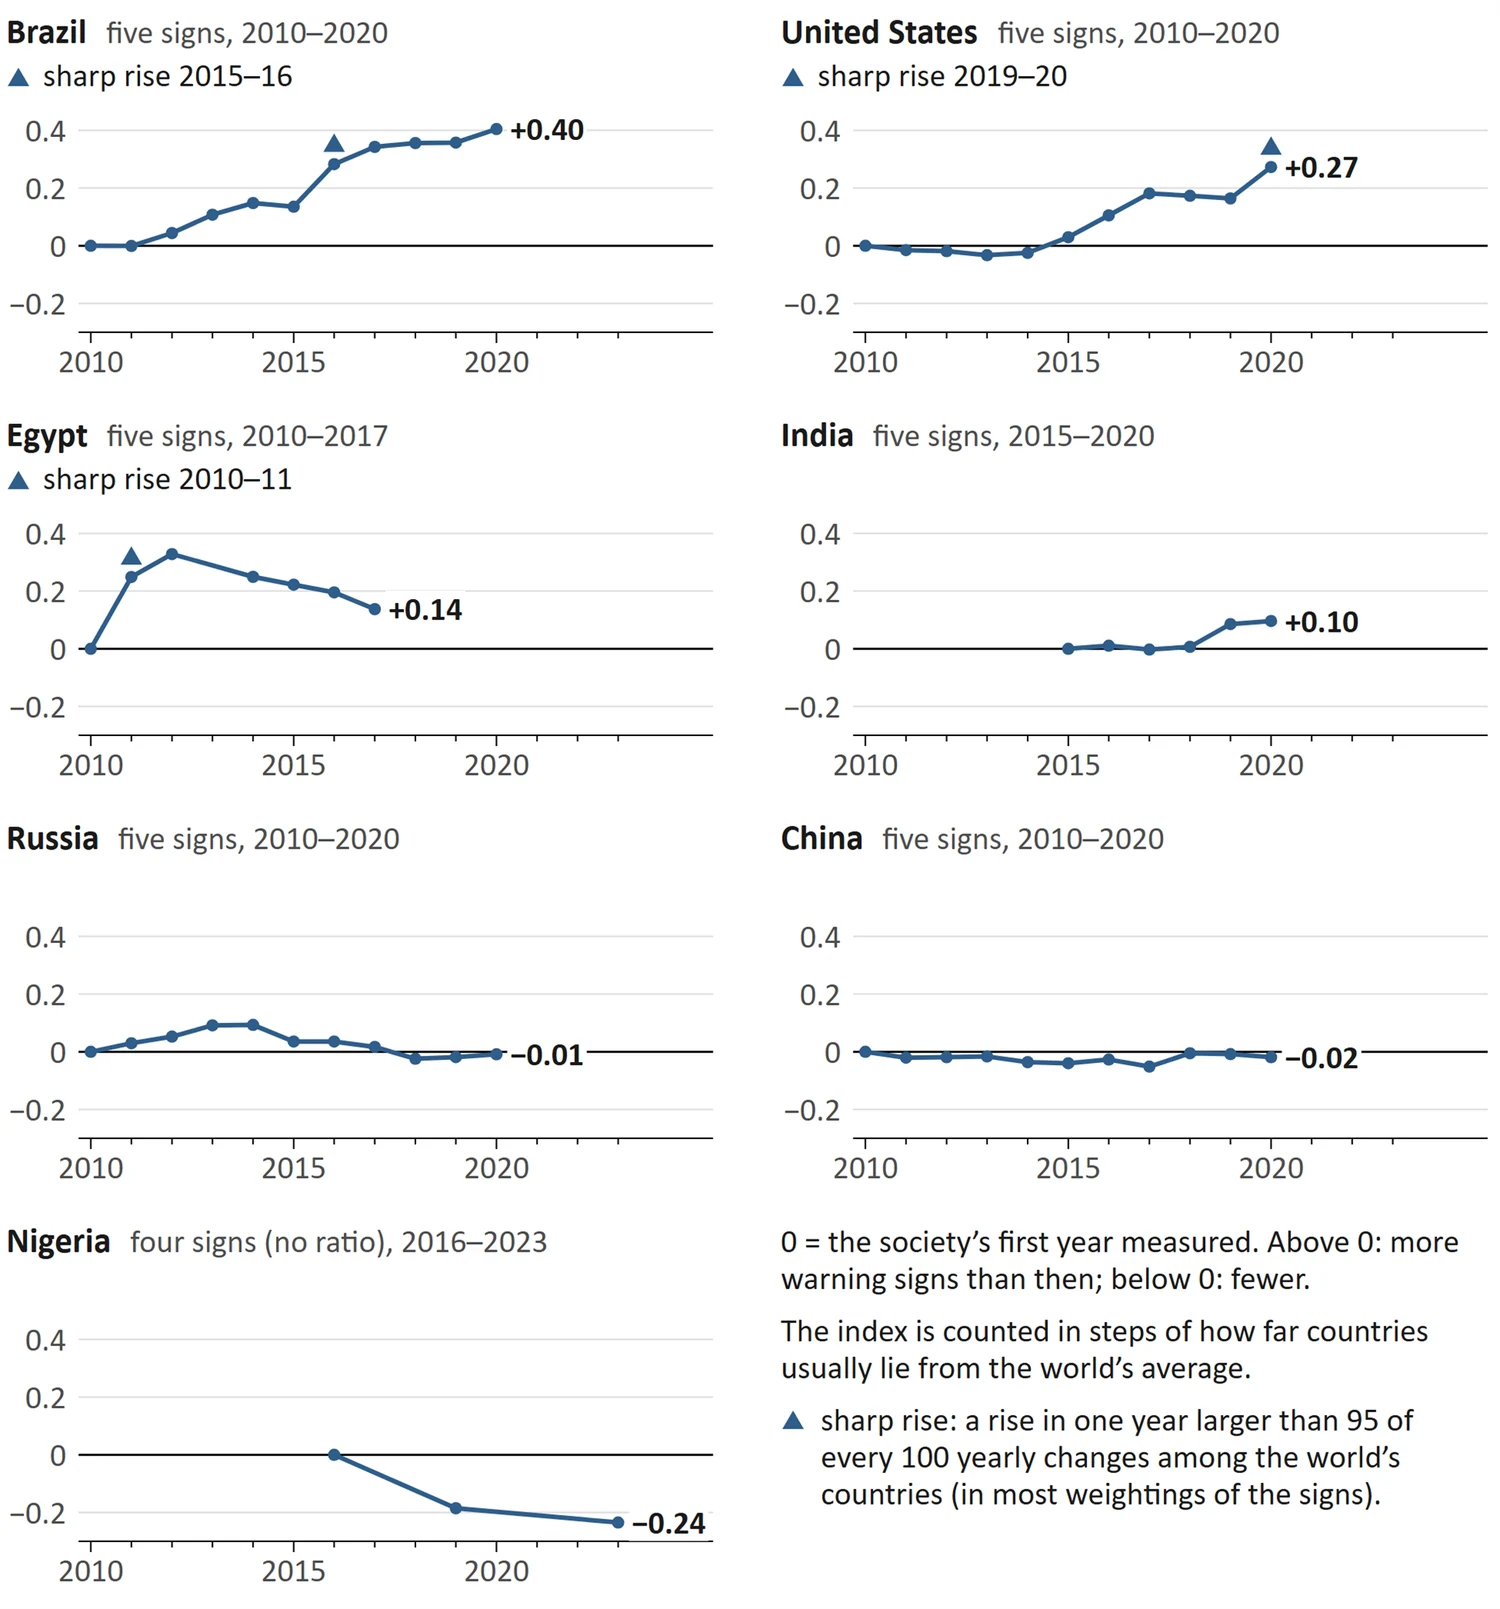
Chart 1 Are You a Worthful Person?Chart 2 Respect Is Not Costly, the Ingredients Are UniversalChart 3 The Equilibrium of Desire and NecessityChart 4 What About the Gifts of Nature?Chart 5 Is Retribution Essential?Chart 6 Is Retribution Essential?Chart 7 Is Retribution Essential?Chart 8 Guidance and Its GuardiansChart 9: The seven societies and their people. The most populous country of each of the seven World Bank regions, by its number of people in 2025. The Current Status of the SocietyChart 10: Participation to Burden ratio of seven societies, in hours. Each society's value with and without unpaid home work, its narrow-to-broad range marked, against the line at 1 where Natural Participation equals the whole burden. Part 1: Participation to Burden ratio of a SocietyChart 11: The richest 1%: Participation to burden ratio (individual), in hours of work. The final value for the richest 1% of adults in each of the seven societies, with the range from the tests; the line at zero is the brink. Part 2: Participation to Burden ratio of an Individual, Measured for GroupsChart 12: The richest 1%: others' work drawn beyond their own. The hours of other people's work that each adult of the richest 1% draws in a year beyond his own work, in thousands of hours, with the range from the tests. Part 2: Participation to Burden ratio of an Individual, Measured for GroupsChart 13: Four groups in one society: Brazil. The ratio of each income group in Brazil, in hours of work; the line at zero is the brink. Part 2: Participation to Burden ratio of an Individual, Measured for GroupsChart 14: The worth level of the seven societies. The worth level of each society, in hours of NEP work a week per capable adult, with its set point, the hours needed, beside it. Both count only the human work of the society's own capable adults, not the work it draws from others or that coal, oil, gas and other resources do; they are given mostly by the poor and middle classes. Part 3: Overall Worth Level of a SocietyChart 15: The six domains of the production adequacy. For each society, how much of each need its own work produces or provides (1 = enough for everyone), and their average, the production adequacy, from which its set point is found. Part 3: Overall Worth Level of a SocietyChart 16: Needs produced but not reaching the people (the drain). For each society, how much of the food and health needs its own work produces, how much reaches the people, and the gap; the drain is the two gaps added and divided by the five needs; 0 means everything produced reaches the people. Part 3: Overall Worth Level of a SocietyChart 17: The two halves of the preference gradient. For each society, the voluntary suppression of one's own burden (S) and the squeezing of societal burden (Q), each with the world average set at 1; the preference gradient is their average. Part 4: Overall Respect Level of a SocietyChart 18: Respect value of the seven societies. The respect value of each society, preference gradient × worth level, with 1 marking a world-average preference gradient where the hours given to the NEPs equal the hours needed. Part 4: Overall Respect Level of a SocietyChart 19: Efficiency level of each resource, per kilogram. Each bar is one resource's efficiency level on the scale set by firewood (+1) and coal (−2), drawn on a scale where each gridline is ten times the one before, with a mark showing whether the resource satisfies the green check. Part 5: Efficiency Level of the Natural Resources, and the VilChart 20: VIL depth: how much of the provision of the NEPs rests on resources that do not satisfy the green check. How much of the NEPs depends on resources that do not satisfy the green check: the share of the provision of food, shelter (cooking and heating), organizational tasks (transport) and electricity that would stop if those resources vanished at once, for each of the seven societies, with its range. Part 5: Efficiency Level of the Natural Resources, and the VilChart 21: The set point now and if the failing resources vanished. The hours of NEP work needed a week per capable adult (the set point of Part 3) now and if the resources that do not satisfy the green check vanished at once, with the farm work that machines do now done by hand, beside the hours given now (the worth level). These resources do much of the physical work, so without them the same hours would produce less of the NEPs and the hours needed would rise: the darker part of the third bar is the rise with the food from factory-made nitrogen, the wild fish and the electricity lost; the paler part adds the hard work of doing by hand the farm work that machines do now, at 60 watts, which a person can keep up for about 4 hours a day. The thin line runs from the low to the high value in the table above. Part 5: Efficiency Level of the Natural Resources, and the VilChart 22: The seven societies side by side. The final value of each of the five formulas for each society, with the reference point for each column; the societies are ordered by the first column. Part 6: The Seven Societies Side by SideChart 23: Participation to Burden ratio of a society. Hours of NEP work for every hour of work contained in what the society consumes, paid work only and with unpaid home work (cooking, cleaning, caring) counted on both sides; 1 means participation equals burden. Part 6: The Seven Societies Side by SideChart 24: Ratio of the richest 1%. (Self Participation + Stolen Participation) ÷ Artificial Burden for the richest 1% of adults as one group; the line at zero is the brink, where their own work equals the work they draw from others. Each adult of the group draws from 12,529 (Nigeria) to 24,899 (Russia) hours of others’ work a year beyond their own (Part 2). Part 6: The Seven Societies Side by SideChart 25: Overall worth level. The hours given to the NEPs a week per capable adult, with the set point, the hours needed, beside it. The first bar counts only the work of the society’s own capable adults; part of what a society uses is made by the work of other societies. In farming, food and clothing, three of the seven draw more of this work from other societies than they give (0.3 to 4.1 hours a week per capable adult, net), and three give more than they draw (0.9 to 1.3 hours); the exports of the seventh are not in the trade tables. Two of the three that give stand below their own set point: they send out part of their NEP work while their own NEPs remain unmet, i.e. they are being drained of their Pads (see the Shock and Pad Theory in THE DESTINED FUTURE (HSPs)). Food sent to others counts towards the needs only where a society gives more of this work than it draws (Part 3). Part 6: The Seven Societies Side by SideChart 26: Respect value. Preference gradient × worth level (as a share of the set point); 1 is the reference point, a world-average preference gradient where the hours given to the NEPs equal the hours needed, not the average of all countries. The middle three values are too close to be told apart, and so are Brazil and the United States (both 0.79). Part 6: The Seven Societies Side by SideChart 27: VIL depth. The share of the provision of the needs that rests on resources that do not satisfy the green check; the standard is 0%: no need should rest on a resource that does not satisfy the green check. Part 6: The Seven Societies Side by SideChart 28: The warning index of the seven societies, year by year. The warning index of each society, year by year, from its first year with every sign measured, the signs weighed equally: the four warning signs and the Participation to Burden ratio (Nigeria: the four signs, as its ratio is not measured). The warning signs of the elastic limit