
The formula as written
In THE UNJUSTIFIED BURDEN AND ITS IMPLICATIONS, the ratio is first defined and then given as a formula for the society as a whole:
‘It is defined as the ratio of collective participation to the whole burden applied to the society.’
To determine this, we consider the Natural Participation as the prime value compared with the collective burden (artificial + natural) while considering the whole society as one unit.
Participation to burden ratio (Societal) = Natural Participation ÷ (Natural burden + Artificial burden)
The same paragraph names the unit and the way to measure it:
(In practice, participation can be measured as the hours an individual works in the NEPs, and burden as the hours of others’ work contained in what he draws from the societal pool, used at once or held, so that both are counted in the same unit. The ratio of the society as a whole can then be worked out every year from a representative sample of households, scaled up to the whole society and reported with its margin of error.)
What it measures, in plain words
The top of the fraction is the work that a society's people do for the NEPs: the Needs (food, shelter, clothing, organizational tasks, peace and security), the Environmental Stress (planning, natural disaster management, weather adaptation) and the Physical Stress (wartime strategy, crime management, rebel engagement). The bottom is all the work that went into everything the society uses, in line with the NEPs (natural burden) or beyond them (artificial burden). As the formula adds the two burdens, nothing has to be sorted: everything used is counted.
Why hours? Both sides are measured in "the net work done": participation is work given, and burden is work drawn from the societal pool. An hour of work is the plainest measure of work there is. It is the same in every country, untouched by prices, currencies or exchange rates (in money, the same loaf of bread would be a bigger burden wherever bread is dear). It fits both sides of the fraction: the hours a person gives, and the hours inside what he uses. And it follows work across borders, so hours worked in another land for us still count as our burden.
What does "hours embodied in consumption" mean? To understand this, let's take an example of a cotton shirt. Before it reaches the buyer, a farmer grew the cotton, a spinner and a weaver made the cloth, a tailor sewed it, drivers and sailors carried it and a shopkeeper sold it; a little of the time of those who built the looms, the lorries and the shop went into it too. Add up all those hours, wherever they were worked, and you have the hours embodied in the shirt. Do the same for everything a society uses in a year (food, homes, clothes, medicines, services, roads, machines) and you have the hours embodied in its consumption. In the same way, a building is the compressed work of all who made its material and raised it (see RESPONSIBILITIES FOR THE WEALTH).
So a ratio of 1 means that the society's NEP work equals all the work its consumption draws on. Below 1, its consumption draws on more work than its people put into the NEPs; the difference is carried by its own other work or by other people's work, at home or abroad.
How we measured it
Natural Participation: hours worked in the NEPs
Labour-force surveys count how many people work in each industry and their hours a week; multiplying the two gives the hours worked in each industry. We kept the jobs of capable adults (aged 15 to 64) and drew the line between NEP work and other work with this test, set out in THE UNJUSTIFIED BURDEN AND ITS IMPLICATIONS:
To know whether a task is Natural Participation, just ask whether the society would suffer in any of its NEPs if that task were stopped; if yes, it is Natural Participation (e.g. a farmer, a builder, a teacher, a doctor, a soldier), and if not, it is a surplus play (e.g. luxury fashion, entertainment beyond relief, speculative trading).
Surveys report industries, not single tasks, so the test was applied industry by industry (codes from the international list of economic activities, ISIC Rev.4).
| Industry (ISIC Rev.4 code) | The NEP it serves | Counted in |
|---|---|---|
| Agriculture, forestry and fishing (A) | food | narrow and broad |
| Food, textile, clothing and leather factories (C10, C13, C14, C15) | food, clothing | narrow and broad |
| Power, gas, water, sewerage and waste (D, E) | shelter, weather adaptation | narrow and broad |
| Construction (F) | shelter | narrow and broad |
| Public administration and defence (O) | organizational tasks, planning, peace and security, wartime strategy | narrow and broad |
| Security services (N80) | security, crime management | narrow and broad |
| Education (P) | teaching (the teacher, an example in the test above) | narrow and broad |
| Health and social work (Q) | healing (the doctor, an example in the test above) and care | narrow and broad |
| Household service (T) | food, shelter, care | narrow and broad |
| Mining and quarrying (B) | fuel and materials for the NEPs | broad only |
| Transport and storage (H) | carrying food, fuel and goods | broad only |
Mining and transport pass the test only in part: food and fuel reach people through them, yet much of their work serves surplus play (mining for ornaments, carrying luxury goods). So they form the outer edge of the boundary, and both edges are shown. Everything else (trade, finance, information, entertainment, most factory work) is left out of the top of the fraction. This is no verdict on that work, as other participation is not lethal in all circumstances (see THE UNJUSTIFIED BURDEN AND ITS IMPLICATIONS); these industries, as a whole, do not pass the test. Their products still count on the burden side whenever they are used. NEP hours count wherever their fruit goes: food grown for other countries is still NEP work.
Burden: hours embodied in consumption
Tracing every hour of every shirt by hand is impossible, but statisticians have built tables that do it for whole economies. Input-output tables record what every industry in every country buys from every other, so the work inside a final product can be followed back through each stage and across borders. From them, the Trade in Employment database gives, for 61 economies, how many jobs at home serve the society's own final use, how many serve buyers abroad, and how many jobs in each other economy serve the society. "Final use" means what households and the government use and what is built to last (homes, roads, machines). The latest year is 2020.
Each job was turned into hours with the weekly hours of the country where the job is (for China, its national figure of 47 hours). Then:
· hours worked = all the society's jobs × its weekly hours;
· hours embodied in consumption = (jobs serving its own final use × its weekly hours) + (jobs abroad serving it × the weekly hours of each of those countries);
· all-hours ratio R = hours worked ÷ hours embodied in consumption.
Putting the two sides together
The ratio is NEP hours divided by hours embodied in consumption, which can be worked out in two easy steps:
Participation to burden ratio (Societal) = (NEP hours ÷ all hours worked) × (all hours worked ÷ hours embodied in consumption) = S × R
where S is the NEP share of paid hours and R is the all-hours ratio. S tells how much of the society's work is NEP work; R tells whether its consumption draws on more work than its people do, or less.
Unpaid home work
Cooking, cleaning and caring for children and the old at home are NEP work, but no job survey counts them. Time-use surveys do: people record what they did through the day. We took the share of the day adults spend on unpaid domestic and care work, turned it into hours a week (share × 168) and added it to both sides, because a meal cooked at home is made and eaten at home: it is participation and burden at once. Adding equal hours to both sides moves any value below 1 closer to 1, so this second reading is higher for every society; it is shown beside the paid-work reading, not in its place.
A worked example: Brazil
Brazil sits near the middle of the seven, and its data come straight from national surveys.
| Step | What is counted | Calculation | Result |
|---|---|---|---|
| 1 | Hours worked (2020) | 99.205 million jobs × 37.67 hours a week | 3,737.0 million hours a week |
| 2 | Hours embodied in consumption (2020) | 83.270 million jobs at home × 37.67, plus 4.803 million jobs abroad × 42.62 (their average hours) | 3,136.8 + 204.7 = 3,341.5 million hours a week |
| 3 | All-hours ratio R | 3,737.0 ÷ 3,341.5 | 1.1184 |
| 4 | NEP hours (2025, narrow) | sum of the industries below | 1,641.0 million hours a week |
| 5 | All paid hours (2025) | 97.975 million jobs × 38.86 hours | 3,807.3 million hours a week |
| 6 | NEP share S | 1,641.0 ÷ 3,807.3 (narrow); plus mining 0.006 and transport 0.058 (broad) | 0.431; 0.495 |
| 7 | Ratio, paid work | 0.431 × 1.1184; 0.495 × 1.1184 | 0.48 to 0.55 |
In step 2, 15.935 million of Brazil's 99.205 million jobs served buyers abroad, leaving 83.270 million for its own use. Step 4, industry by industry (jobs of people aged 15 to 64):
| Industry | Jobs (millions) | Hours a week | Million hours a week |
|---|---|---|---|
| Agriculture, forestry, fishing | 7.45 | 37.63 | 280.3 |
| Power, gas, water, waste | 0.73 | 41.04 | 30.1 |
| Construction | 7.27 | 39.10 | 284.1 |
| Public administration, defence | 5.00 | 38.32 | 191.6 |
| Education | 6.23 | 34.43 | 214.4 |
| Health and social work | 6.68 | 37.96 | 253.7 |
| Household service | 5.61 | 31.56 | 177.1 |
| Food and clothing factories, security | 5.21 | 40.24 | 209.6 |
| All NEP industries | 44.18 | 1,641.0 |
(Totals are taken from unrounded figures.)
With unpaid home work, everything is put per capable adult (147.12 million people aged 15 to 64: 74.26 million women, 72.86 million men): paid hours 3,807.3 ÷ 147.12 = 25.88 a week; NEP hours 1,641.0 ÷ 147.12 = 11.15; hours embodied in consumption 25.88 ÷ 1.1184 = 23.14. Brazilian women spend 11.783% of the day on unpaid home work (× 168 = 19.80 hours a week) and men 5.695% (9.57 hours), 14.73 hours per adult on average. So:
· narrow: (11.15 + 14.73) ÷ (23.14 + 14.73) = 25.88 ÷ 37.87 = 0.68;
· broad: (0.495 × 25.88 + 14.73) ÷ 37.87 = 27.54 ÷ 37.87 = 0.73.
In plain words, Brazil's people work more hours than its consumption draws on (R above 1), but their NEP hours cover about half of it.
The results for the seven societies
The reference points for the societal case are these:
| Value | What this value means |
|---|---|
| 1 or more | "Natural Participation must suffice for or override the burden to sustain the society"; "this represents the efficiency of the society" |
| greater than 0 and less than 1 | "the society is not self-sufficient" |
| 0 | "This is just like a death sentence" |
| negative | "Not a defined value as per the formula or simply undefined." |
Below 1, the value is also read together with the society's resources, short or plentiful; that reading is made in Part 6, where the resources are brought in.
| Society | NEP share of paid hours | All-hours ratio R (2020) | Ratio, paid work (narrow–broad) | Ratio, with unpaid home work |
|---|---|---|---|---|
| India | 0.62–0.67 | 1.11 | 0.71 (0.69–0.74) | 0.85 (0.84–0.86) |
| Egypt | 0.53–0.62 | 0.98 | 0.56 (0.52–0.60) | 0.79 (0.77–0.81) |
| Brazil | 0.43–0.49 | 1.12 | 0.52 (0.48–0.55) | 0.71 (0.68–0.73) |
| China | 0.42–0.47 | 1.10 | 0.50 (0.47–0.52) | 0.68 (0.66–0.69) |
| Russia | 0.39–0.50 | 1.06 | 0.47 (0.41–0.53) | 0.69 (0.66–0.73) |
| United States | 0.41–0.47 | 0.68 | 0.30 (0.28–0.32) | 0.55 (0.53–0.56) |
| Nigeria | 0.44–0.47 | not available | not measurable | not measurable |
Sources: see the Sources list, Part 1.
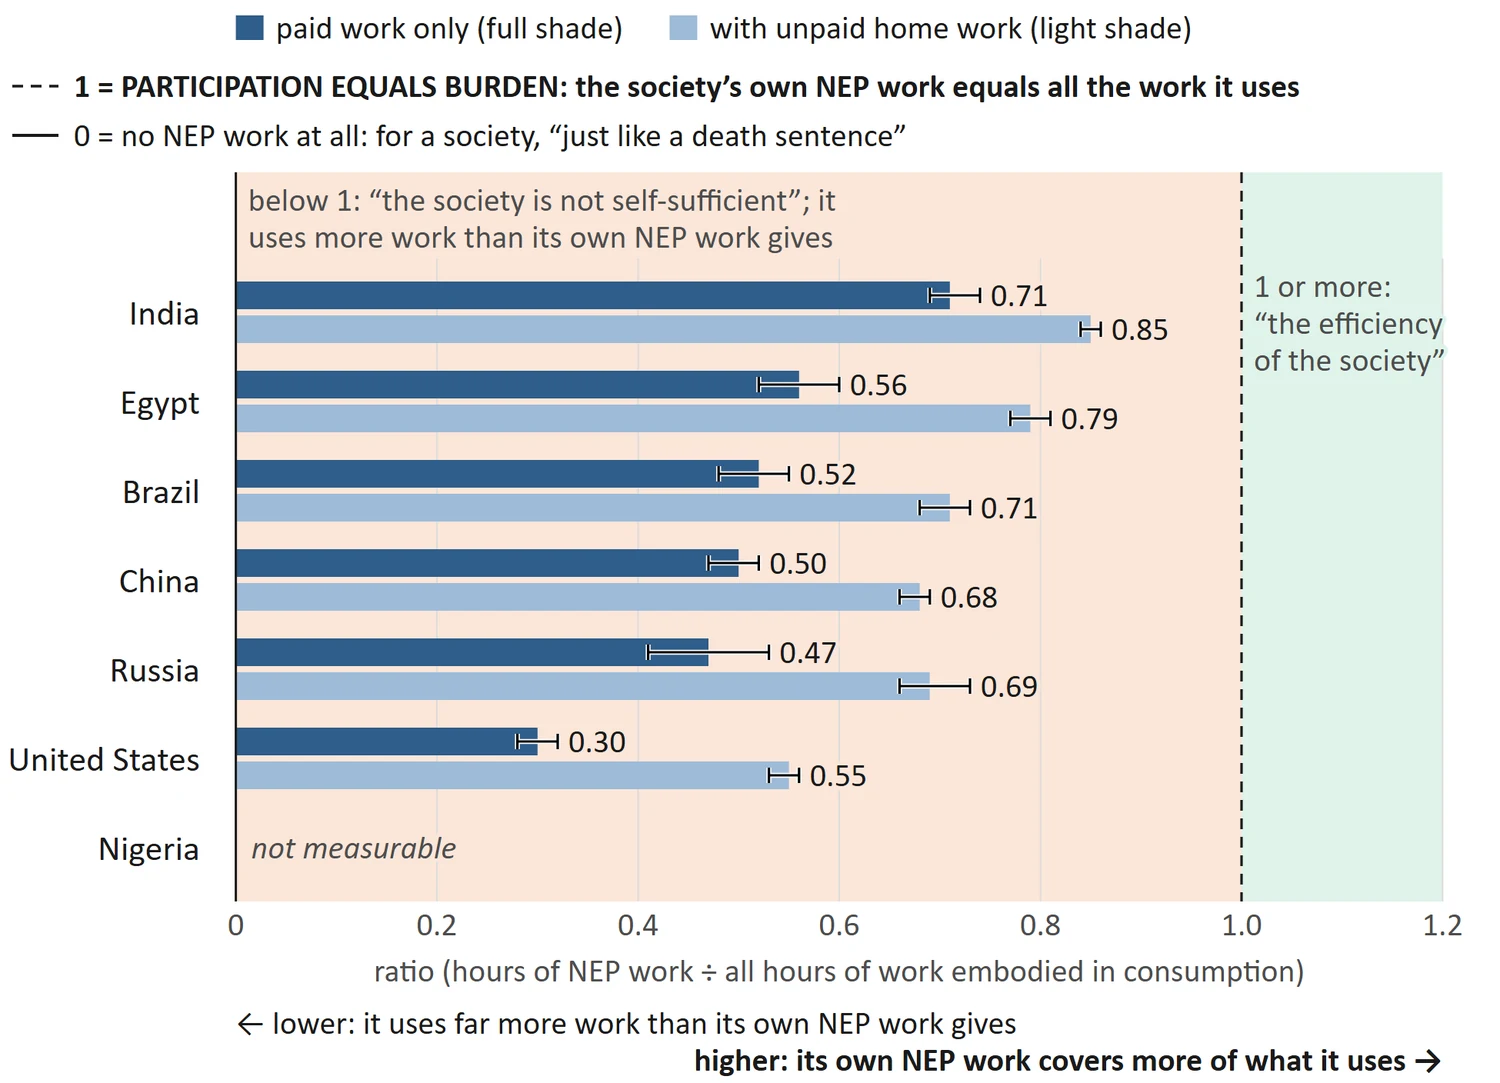
Chart 10: Participation to Burden ratio of seven societies, in hours. Each society's value with and without unpaid home work, its narrow-to-broad range marked, against the line at 1 where Natural Participation equals the whole burden.
The final value of each society, in bold, is the middle of its paid-work range.
· All six measured values lie between 0 and 1; none reaches 1. The highest is 0.71 (India), the lowest 0.30 (United States).
· With unpaid home work every value rises, to between 0.55 and 0.85; none reaches 1.
· In 2020 the consumption of the United States drew on 1.47 hours of work for each hour its own people worked, and Egypt's on 1.02; the people of Brazil, China, India and Russia worked more hours than their own consumption drew on. Egypt's place here belongs to the pandemic year: in 2018 and 2019 its people worked slightly more hours than its consumption drew on (1.03 and 1.01 jobs at home for each job serving it), while the United States drew on more than it gave in all three years.
· Nigeria cannot be measured. The Trade in Employment table lists it only as a buyer (the hours other economies put into its consumption), not as a producer, so its people's work for others is unknown and R cannot be completed. Its NEP share, 0.44–0.47, would be its ratio only if its trade in work hours were balanced, which cannot be checked.
Extra checks were run. In all four readings (narrow or broad, with or without home work), India and Egypt come first and second and the United States last; Brazil, China and Russia sit close together, and their order changes from reading to reading. Counting persons instead of hours moves R by no more than 0.04.
Calculate it for any other society
You need five sets of data (download addresses in the Sources list, Part 1):
1. OECD Trade in Employment (TiM), 2023 edition, dataflow DSD_TIM_2023@DF_TIM_2023, year 2020, all activities (_T), persons (PS): indicators EMPN (Employment) and FFD_DEM (Domestic employment embodied in foreign final demand). FFD_DEM with partner W gives your society's jobs serving all buyers abroad; FFD_DEM with your society as partner gives the jobs in each other economy that serve it.
2. ILOSTAT, Average weekly hours actually worked per employed person by sex and economic activity (DF_HOW_TEMP_SEX_ECO_NB): the total for your society and for every economy in item 1 (year 2020), and the hours of each NEP industry (latest year).
3. ILOSTAT, Employment by sex and economic activity (DF_EMP_TEMP_SEX_ECO_NB), with Employment by sex and economic activity - ISIC level 2 (DF_EMP_TEMP_SEX_EC2_NB) for codes C10, C13, C14, C15 and N80. (We also removed jobs held by people aged 65 and over, from Employment by sex and age, DF_EMP_TEMP_SEX_AGE_NB; this trims NEP and other jobs alike, so it hardly moves S.)
4. UN SDG indicator 5.4.1, series SL_DOM_TSPD, Proportion of time spent on unpaid domestic chores and care work, by sex, ages 15 and over.
5. World Bank, Population ages 15-64, female and male (SP.POP.1564.FE.IN, SP.POP.1564.MA.IN).
| Step | What | How | Brazil | Your society |
|---|---|---|---|---|
| 1 | Hours worked | EMPN × own weekly hours | 3,737.0 | |
| 2 | Hours embodied | (EMPN − FFD_DEM to W) × own hours + Σ (jobs abroad serving you × their hours) | 3,341.5 | |
| 3 | R | step 1 ÷ step 2 | 1.1184 | |
| 4 | NEP share S | Σ (NEP industry jobs × hours) ÷ (all jobs × average hours) | 0.431–0.495 | |
| 5 | Ratio, paid work | S × R | 0.48–0.55 | |
| 6 | Paid hours per adult P | all jobs × average hours ÷ population 15–64 | 25.88 | |
| 7 | Unpaid hours per adult U | share of the day × 168, averaged over women and men | 14.73 | |
| 8 | Ratio, with home work | (S × P + U) ÷ (P ÷ R + U) | 0.68–0.73 |
If your society is not in the Trade in Employment table, the simplest honest fallback is R = 1, so that the ratio equals the NEP share S. This assumes your society gives as many hours to buyers abroad as others give to it. It loses exactly the flow of work between societies: it cannot show whether a society's consumption leans on other people's work or gives its own work away. Write the result as an assumption, not a measurement.
Limits
· The NEP boundary is drawn by industry, not by task: some hours inside NEP industries serve surplus play, and some NEP work lies elsewhere. Both edges are shown. China's household service and Russia's food and clothing factories are not reported, so their narrow values are slightly low.
· The flow of work between societies is for 2020 (the table's latest year, a pandemic year); industry hours are for 2024–2025 (China's for 2016, raised to the 2024 level). Work done outside the 61 economies for a society's consumption is missing, so burdens are somewhat understated and ratios, if anything, a little high.
· Every hour counts the same, whether its work is mostly physical or mostly mental: by the Work-Position Similarity Theory, physical work decreases and mental work increases from lower to upper levels, while in an ideal society the sum stays comparable at each level (quoted in Part 2). Each hour may also be weighed by the expertise it needed (see RESPONSIBILITIES FOR THE WEALTH); that is not done here.
· The ratio is to be worked out every year from a sample of households, with its margin of error (see THE UNJUSTIFIED BURDEN AND ITS IMPLICATIONS); here national totals are used, and the ranges come from the boundary, not from sampling. Time-use surveys date from 2018 (China) to 2025 (the United States); Egypt's is a 2023 time diary.
· Nigeria is not measurable.