
The formula as written
The rule "RESPECT IS NOT COSTLY, THE INGREDIENTS ARE UNIVERSAL" opens with this statement:
“An individual must give respect to other individuals according to their worth level, with the preference gradient being the core value.”
Its formula is:
Respect value = Preference Gradient × Worth level
and the preference gradient is itself the sum of two parts:
Preference gradient = (Voluntary suppression of one's own burden) + (Squeezing societal burden by efficient strategy)
These are the two measuring standards of the preference gradient. The first (where "these" are one's own needs):
In determining the preference gradient, the voluntary suppression of these is taken into account primarily.
The second:
The second measuring standard is the work done to squeeze the burden applied by other individuals to the society.
What it measures, in plain words
The respect value asks two things of a society: how sincerely its people prefer others (the preference gradient), and how much they participate in the NEPs (the worth level, Part 3, taken here as a share of the set point). The two are multiplied, so respect needs both; a zero in either gives a respect value of zero.
The preference gradient adds two halves: what a person gives up from his own share so that the needs of others are met, and the work he does to bring down the burden that other people place on the society. Because the halves are added, a society that is low in one can still earn part of its preference gradient through the other.
To understand this, let's take an example of two neighbours. A tailor sets aside part of each week's earnings for a family next door that cannot meet its needs, and lives a little below what his own work allows; he suppresses his own burden. A schoolteacher with less to spare persuades the households of the street to mend their leaking taps and share one water pump instead of each digging its own well; she squeezes the burden of the whole street. Both raise the preference gradient of the street.
Suppression is the main measure because it shows sincerity: participation can be raised for the sake of status, but giving up one's own share is "the most direct measure of sincerity".
How we measured it
In practice, “the preference gradient can be known through the witnesses, i.e. those who have seen an individual’s preference for others, and through observing the locality: if the anonymous giving in an area is abundant, this shows that its locals have a high preference gradient.” For a whole society, the locality is read here through large surveys of randomly chosen adults. The gradient has no unit of its own, so each measure is set against the world: 1 is the world average, 2 is twice it.
Where numbers are combined, we use the geometric mean: multiply them and take the square root (for two) or the cube root (for three). Unlike a plain average, it does not let one high number hide a low one.
The first half: voluntary suppression of one's own burden (S)
Sharing is "the voluntary suppression of one’s own burden by giving away a part of one’s resources". The matching measure is the share of his own income that a person gives, in a year, directly to people in need, as reported in a survey of 105 countries and averaged over the adults of each country.
It is a share of one's own income because every level of a society has its own normal standard of living, and suppression means living voluntarily below the normal of one's own level. A labourer who gives away a day's wage out of his month and a mill owner who gives away a day's profit out of his month have suppressed the same part of their burden, each on his own scale. Against one fixed line for everybody, the mill owner would seem to give far more, and a labourer who lives low only because he is given little would seem to be suppressing simply by being poor. Forced low living is not suppression: forced worthfuls are "already being forced to minimize their own burden because they are not given appropriate resources", and in an ideal society nobody is "forced to decrease their legitimate burden". Totals of carbon, energy or footprint, which cannot show what was voluntary, are left to Parts 1 and 2.
Giving made for one's own benefit is screened out, as there is "a high risk of gaining social status as the root cause of artificial caretaking".
· Counted: money handed directly to a person or a family in need. It passes through no institution and brings no tax relief and no public name.
· Not counted: giving through charities (it can bring tax relief, a named gift or standing); giving through religious routes (much of it is felt as a duty, and one who acts "only because they deem it an obligation" has a zero preference gradient); political and company spending; and large philanthropy.
S = the share given directly ÷ 0.551%, the world's share (the average of 104 countries, each weighted by its population).
Endurance "sets its limit". As a check, the same giving was divided by the room each society has above its necessity, counted in hours of work with no currency: room = 1 − (natural burden ÷ the hours of work drawn by an average capable adult), both from Part 2. Of this room, India and Nigeria give 3.0% each, Egypt 2.6%, China 0.9%, Brazil 0.6%, Russia 0.5% and the United States 0.4%. India has the least room, as more than three-quarters of the work its adults draw goes to the NEPs. With this check, India moves to the top of the respect values (1.65), ahead of Egypt (1.59) and Nigeria (1.29), and the lower three stay the lower three.
The second half: squeezing societal burden (Q)
Squeezing is "the work done to squeeze the burden applied by other individuals to the society. It is primarily done by persuading others to apply efficient strategies (according to the capability level of the person devising the strategy)." In other words, it means "working on the burden of other people, i.e. by increasing their respect level, by encouraging them to ward off their burden, or by devising strategies that lead to the downscaling of burden on the society as a whole". Three routes stand for it, each set so that 1 = the world average (for the third, what comparable societies did):
1. Caring acts ("caring is the work done to squeeze the burden of others"): the geometric mean of the share of adults who helped a stranger in the past month and the hours volunteered per person, then combined with the share of donated blood given unpaid and voluntarily. Blood given for one's own relative or for payment is screened out.
2. Raising others' preference: the share of adults who name unselfishness as a quality that children should learn at home, against the average (26.5%) of the 24 countries for which it is published. India is not among them, so its Q uses the other two routes.
3. Strategies, judged by capability ("according to the capability level of the person devising the strategy"): the change in burden per person from 2010 to 2022 (carbon dioxide from consumption, and the ecological footprint of consumption; both count imports), against what societies of the same capability did. Capability is counted in work, not money: the hours of human work a society commands per person in a year, i.e. the hours contained in all it uses (Part 1's tables), its level in 2010 and its growth to 2019. Score = (1 + peers' expected change) ÷ (1 + own change); above 1 means the burden grew less, or fell more, than the peers'. The two scores are combined by their geometric mean.
The forced guard. A burden that falls because people go hungry is not chosen. Where the share of undernourished people rose by 2 points or more over the same years, a fall below peers is not credited: the score is held at 1, while a rise above peers would still count. This applies to Egypt (5.1% to 8.6% undernourished) and Nigeria (10.5% to 20.8%).
Q is the geometric mean of the three routes:
| Society | Caring acts | Teaching unselfishness | Strategies | Q |
|---|---|---|---|---|
| Egypt | 0.97 | 1.32 | 1.00 (guard) | 1.09 |
| Nigeria | 0.54 | 0.60 | 1.00 (guard) | 0.69 |
| India | 0.87 | not surveyed | 0.79 | 0.83 |
| China | 1.13 | 1.09 | 0.73 | 0.97 |
| United States | 1.09 | 1.06 | 1.02 | 1.06 |
| Brazil | 0.87 | 1.13 | 1.03 | 1.01 |
| Russia | 0.91 | 0.60 | 0.89 | 0.79 |
Sources: see the Sources list, Part 4.
Household food waste was not scored, although teaching one's neighbours to stop wasting food is a plain case of squeezing: the measure counts peels and bones and runs higher in hot countries, so it cannot show who wastes. Honesty, altruism and the neighbours' reports (the witnesses) are checks only: honesty "keeps it real" and the witnesses make the gradient known, but neither is a part of the equation.
Putting the two halves together
Preference gradient (PR) = (S + Q) ÷ 2
Respect value = PR × (Worth level ÷ Set point)
Halving the sum keeps the world at 1 and changes no order between societies (Chart 17). The worth level enters as a share of the set point: the hours of NEP work a week per capable adult divided by the hours needed from each of them, both from Part 3 (steps 2 and 8). So the respect value keeps no unit of its own; its core is the preference gradient. As in Part 3, the work of the richest 1% is not counted in the worth level, since the individual ratio of this measured group is below zero in all seven societies (Part 2).
| Society | Given directly, % of own income | S | Q | PR |
|---|---|---|---|---|
| Egypt | 1.1 | 2.00 | 1.09 | 1.54 |
| Nigeria | 1.2 | 2.18 | 0.69 | 1.43 |
| India | 0.7 | 1.27 | 0.83 | 1.05 |
| China | 0.5 | 0.91 | 0.97 | 0.94 |
| United States | 0.3 | 0.54 | 1.06 | 0.80 |
| Brazil | 0.3 | 0.54 | 1.01 | 0.78 |
| Russia | 0.3 | 0.54 | 0.79 | 0.67 |
Sources: see the Sources list, Part 4.
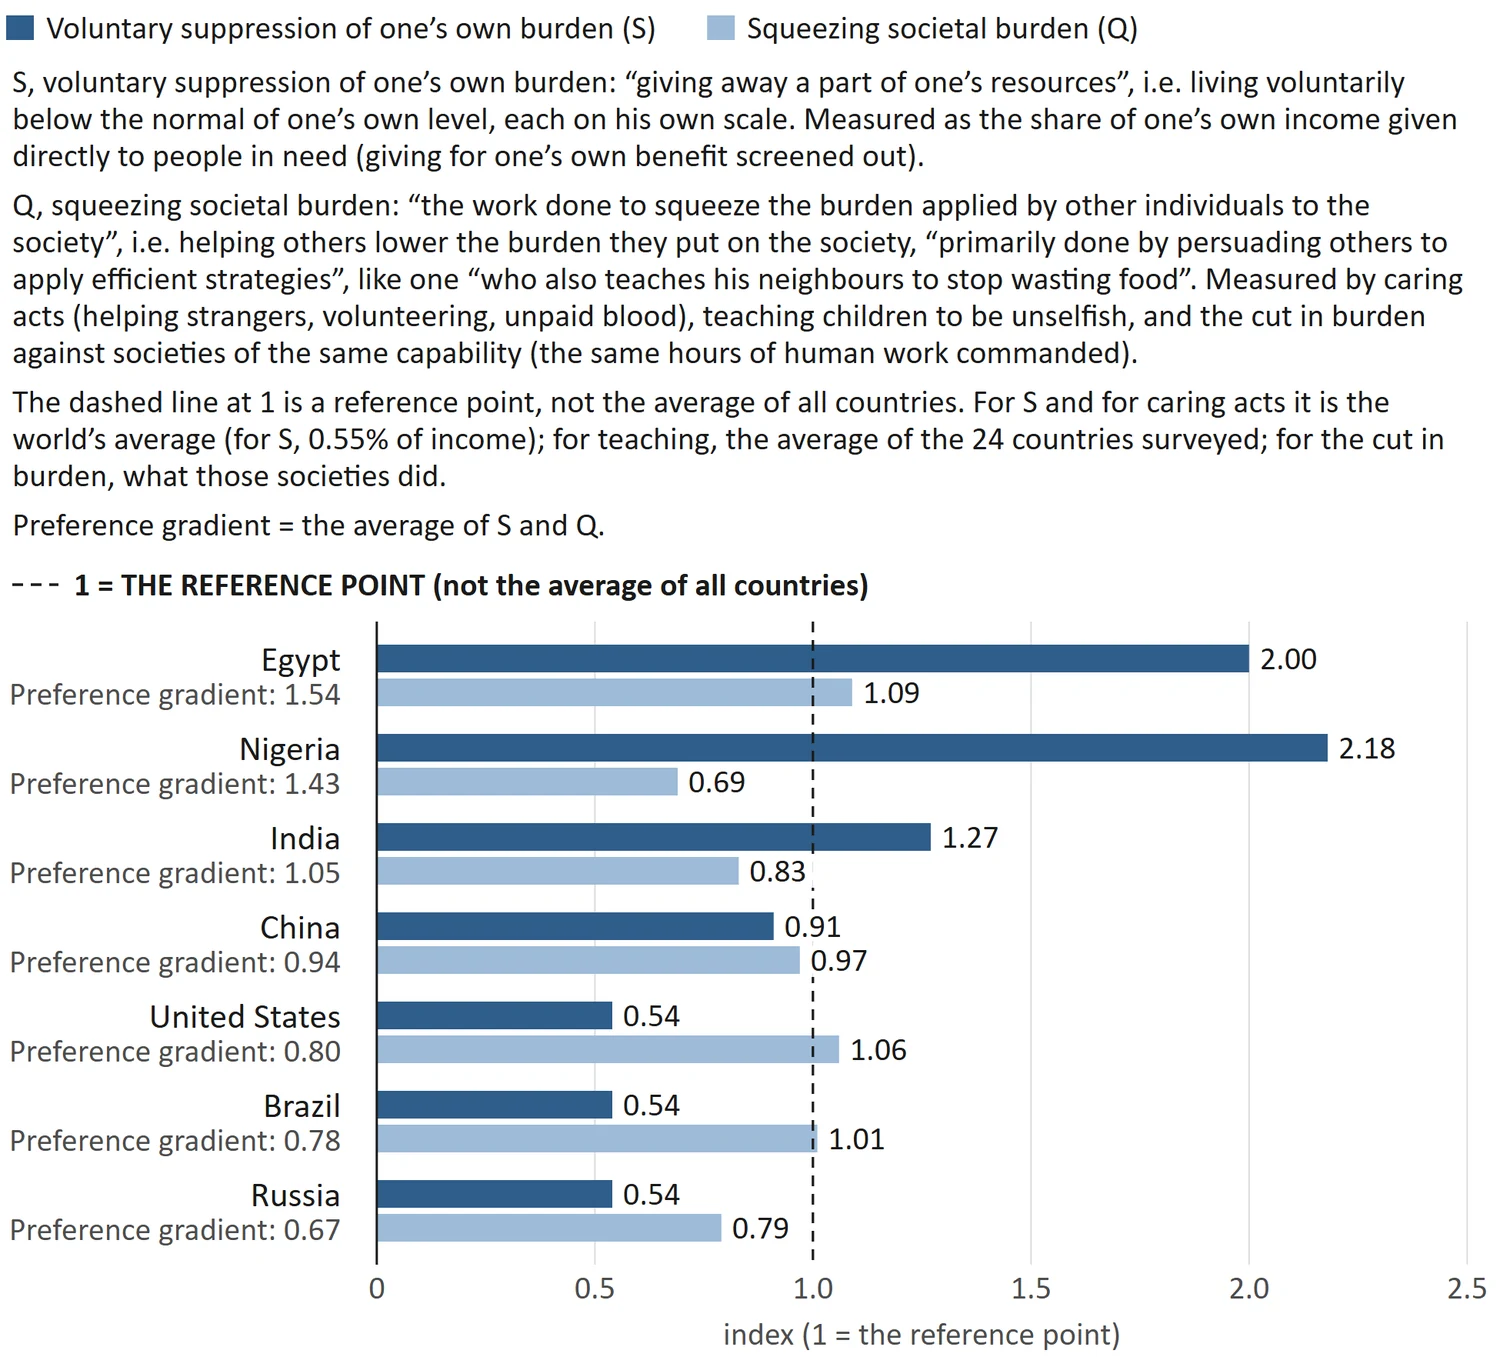
Chart 17: The two halves of the preference gradient. For each society, the voluntary suppression of one's own burden (S) and the squeezing of societal burden (Q), each with the world average set at 1; the preference gradient is their average.
What "1" means. A respect value of 1 is that of a society whose people give and squeeze exactly as much as the world's average and whose capable adults give to the NEPs just the hours needed (a share of 1 of the set point). The zero of the respect value scale still stands: the rebuked and the normal status both have a respect value of zero.
A worked example: Egypt
| Step | What is measured | Numbers | Result |
|---|---|---|---|
| 1 | Given directly to people in need | 1.1% of own income ÷ world 0.551% | S = 2.00 |
| 2 | Endurance check | natural burden 614 hours, average draw 1,063 hours a year per capable adult (Part 2): room = 1 − 614 ÷ 1,063 = 0.423; 1.1% ÷ 0.423 | 2.6% of the room |
| 3 | Caring | helped a stranger 67.8% ÷ 59.6% = 1.14; hours volunteered 9.4 ÷ 9.10 = 1.03; √(1.14 × 1.03) | 1.08 |
| 4 | Caring acts | unpaid voluntary blood 74.5% ÷ 85.4% = 0.87; √(1.08 × 0.87) | 0.97 |
| 5 | Teaching unselfishness | 35% ÷ 26.5% | 1.32 |
| 6 | Strategies, carbon | 2.27 t to 2.38 t (+4.7%); peers with the same hours of work commanded (607 hours per person in 2010, −6.2% by 2019) expected +3.4%: 1.034 ÷ 1.047 | 0.99 |
| 7 | Strategies, footprint | 1.61 to 1.40 gha (−13.1%); peers expected +7.5%: 1.075 ÷ 0.869 | 1.24 |
| 8 | Strategies, with the guard | √(0.99 × 1.24) = 1.11, but undernourished 5.1% to 8.6% (+3.5 points) | held at 1.00 |
| 9 | Squeezing | ∛(0.97 × 1.32 × 1.00) | Q = 1.09 |
| 10 | Preference gradient | (2.00 + 1.09) ÷ 2 | PR = 1.54 |
| 11 | Worth level as a share of the set point (Part 3) | worth level ÷ set point: 32.47 ÷ 36.42 hours a week | 0.892 |
| 12 | Respect value | 1.54 × 0.892 | 1.37 |
Sources: see the Sources list, Part 4.
Counting children and people aged 65 and over (36.8% of Egypt's people) at the normal value of 1, the value for all individuals is 0.632 × 1.375 + 0.368 × 1 = 1.24.
The results for the seven societies
| Society | Preference gradient | Worth level (share of the set point) | Respect value | All individuals |
|---|---|---|---|---|
| Egypt | 1.54 | 0.89 | 1.37 | 1.24 |
| Nigeria | 1.43 | 0.72 | 1.03 | 1.02 |
| India | 1.05 | 0.88 | 0.93 | 0.95 |
| China | 0.94 | 0.98 | 0.92 | 0.94 |
| Brazil | 0.78 | 1.02 | 0.79 | 0.86 |
| United States | 0.80 | 0.99 | 0.79 | 0.87 |
| Russia | 0.67 | 0.97 | 0.65 | 0.77 |
"All individuals" counts children and people aged 65 and over at the normal value of 1. Each number is rounded on its own; the respect value is worked out from the unrounded figures (e.g. India 1.050 × 0.883 = 0.927, shown as 0.93, although 1.05 × 0.88 gives 0.92). Sources: see the Sources list, Part 4.
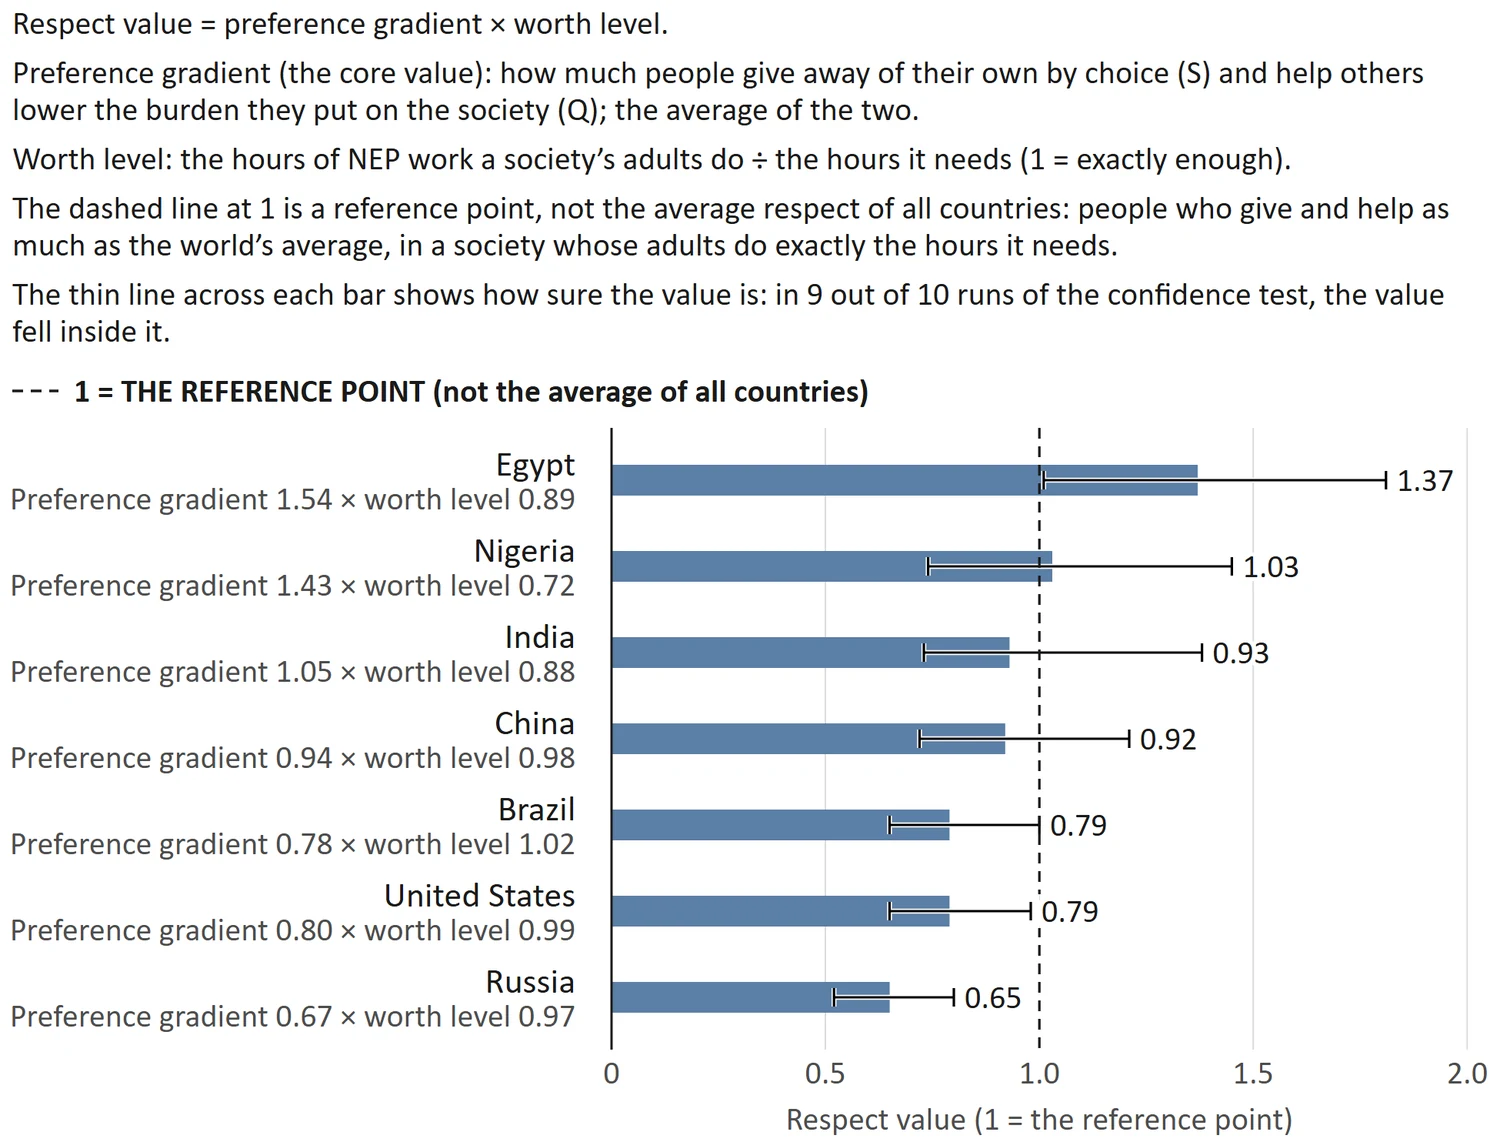
Chart 18: Respect value of the seven societies. The respect value of each society, preference gradient × worth level, with 1 marking a world-average preference gradient where the hours given to the NEPs equal the hours needed.
The values fall into three groups: Egypt (1.37); Nigeria, India and China (1.03 to 0.92); and Brazil, the United States and Russia (0.79 to 0.65). In Egypt and Nigeria, people give about twice the world's share of their own income; in the United States, Brazil and Russia, about half. Nigeria's squeezing is the lowest (0.69), mainly because most of its donated blood is given for a relative or for pay and its fall in burden came with rising hunger, although its people help strangers and volunteer the most of the seven. These values describe what people in each society report doing, on average; they say nothing about any one person.
How sure is the order? The whole calculation was repeated 20,000 times. Each run took one of 18 reasonable versions of the method at random (with or without the blood measure, other years, the endurance check, suppression counted twice, as it is taken into account "primarily", and so on) and shook each society's numbers by chance: about 23% on the giving half (as much as the survey moves between years), 10% on squeezing and 5% on worth.
· Egypt came first in 77% of the runs, in the first two places in 94%, and above the United States in 99%.
· Russia came last in 76% of the runs and in the last three places in 98%; the United States and Brazil were each in the last three in 70%.
· Nigeria, India and China are not firmly ordered: for each pair, one comes out above the other in only 54% to 66% of the runs. Brazil and the United States are a tie (51% to 49%).
(In these runs the squeezing is judged against societies that command the same hours of human work, and the endurance check counts the room in hours, as above. Choosing those societies in six different ways, by the hours of work they command, by the energy they use per person, or by income, keeps all seven places the same.)
Calculate it for any other society
Data needed (latest year; names as the publishers give them):
· Giving: Charities Aid Foundation, World Giving Report, "Explore the data": "Average % of income donated directly to people in need" and "Average hours volunteered per person".
· Room for the endurance check: from the Part 2 worksheet, the natural burden and the hours of work drawn per capable adult a year (H); room = 1 − natural burden ÷ H.
· Helping a stranger: Gallup World Poll, as published in the World Happiness Report 2025, Chapter 2 statistical appendix.
· Blood: WHO Global status report on blood safety and availability 2025, Annex 3: voluntary non-remunerated whole blood donations as a share of all donations.
· Teaching: World Values Survey wave 7, child qualities, share choosing "Unselfishness" (item Q16).
· Burden: Our World in Data, co2-data file: consumption_co2_per_capita and population (2010 and 2022); Ecological Footprint Explorer: ecological footprint of consumption per person (2010 and 2022).
· Capability in work: OECD Trade in Employment (EMPN, FFD_DEM, all activities, 2010 and 2019) and ILOSTAT mean weekly hours actually worked, as in Part 1; hours commanded per person = 52 × [(own jobs − own jobs serving buyers abroad) × own weekly hours + jobs abroad serving your society × their weekly hours] ÷ population.
· Hunger: World Bank SN.ITK.DEFC.ZS, prevalence of undernourishment (% of population), 2010 and latest.
· Worth level and set point: from the Part 3 worksheet, steps 2 and 8.
Steps:
1. S = share given directly (%) ÷ 0.551.
2. Caring = √[(helped a stranger % ÷ 59.6) × (hours ÷ 9.10)]; caring acts = √[caring × (unpaid voluntary blood % ÷ 85.4)].
3. Teaching = unselfishness % ÷ 26.5.
4. Strategies: let G = hours of human work commanded per person in 2019 ÷ in 2010, and Y = hours commanded per person in 2010. Peers' expected ratio for carbon = 4.617 × G^0.3676 × Y^−0.2299; for the footprint = 7.081 × G^1.0397 × Y^−0.2838. If your society is not in the Trade in Employment tables, use its own hours worked per person for both years, as an estimate. Each score = expected ratio ÷ own ratio (2022 value ÷ 2010 value). Strategies = √(carbon score × footprint score). If undernourishment rose by 2 points or more and the result is above 1, write 1.
5. Q = ∛(caring acts × teaching × strategies); if one route is missing, use the square root of the other two.
6. PR = (S + Q) ÷ 2.
7. Respect value = PR × (worth level ÷ set point).
(The two peer lines were fitted across the 58 and 46 economies of at least a million people in the Trade in Employment tables with data for both years.)
| Item | Your society | Reference | Result |
|---|---|---|---|
| Given directly (% of own income) | 0.551 | S = | |
| Helped a stranger (%) | 59.6 | ||
| Hours volunteered per person | 9.10 | caring = | |
| Unpaid voluntary blood (%) | 85.4 | caring acts = | |
| Unselfishness (%) | 26.5 | teaching = | |
| Carbon, 2022 ÷ 2010 | peer line | ||
| Footprint, 2022 ÷ 2010 | peer line | strategies = | |
| Undernourished, change in points | 2 | guard: yes / no | |
| Q, PR, worth level | respect value = |
Limits
· The giving half rests on one survey type: an online survey of 250 to 1,000 adults per country, which in poorer countries leans towards the better-off and rounds to 0.1 point, so the three societies at 0.3% cannot be told apart. No second survey measures the same thing across countries; a household-budget survey in one country shows the same pattern (its poorest fifth gave 1.5% of after-tax income to people outside the home, its richest fifth 0.5%).
· Giving directly to people in need may include relatives outside the home; the survey cannot separate them.
· In the equation the two halves are simply added. No number is given for their weights; suppression is only said to be taken into account “primarily”. So they count equally here, and counting suppression twice as heavily keeps the same order.
· The teaching item is a stated value, not an act, and India has none. The strategies route measures outcomes, and its guard uses hunger alone.
· Peers are judged by the hours of human work they command, not by income. Measured this way, the command of human work per person fell from 2010 to 2019 in five of the six societies in the tables (United States 0.9%, India 2.4%, Russia 6.1%, Egypt 6.2%, Brazil 7.0%) and rose by only 0.15% in China, while some societies' burden still rose with more machines and energy; the hours explain less of the change in carbon (10%) than income did (41%), but much of the change in footprint (40%). With the energy used per person, from all sources, as the peer measure instead, all seven places are the same. The Trade in Employment tables cover 61 economies and end in 2020. Nigeria is not among them, and no figure is put in its place: its fall in burden came with rising hunger, so its strategies route is held at 1 in every version and does not depend on these tables.
· Calmness, peace and integration of a society are "the core of the Preference Gradient". Across about 100 countries, giving on one's own scale shows no clear link with trust, peace or the rule of law once income is held constant; national calm follows wealth, and a society can be calm at home while others carry its burden (Part 1), so this test cannot settle the point.