
Why These Seven Societies, and How to Read the Results
The story of Ahmad has shown a society that lives by these rules, a hypothetical model for now. This last section turns from that picture to the societies we live in today. At the very beginning, two promises were made:
This book will provide you with an insight into what the society looks like when implementing the rules, and a comparison will be made with the current status of the society to efficiently define the evils or disproportionate matters that are witnessed today.
The priority is not to mention individuals specifically while unveiling the oppressive system, but rather to make people aware of their wickedness so that the goal of redemption can be achieved.
Throughout the chapters, that comparison was made in words; here it is made in numbers. Five of the chapters carry a formula: the Participation to Burden ratio of a society and of an individual, the worth level, the respect value, and the efficiency level of natural resources (with the VIL). Each is applied to seven societies of today, step by step, with every number shown, so that you can check it for yourself and then repeat it for any society you choose, your own included.
[This is the comparison with the current status of the society promised at the very beginning; see THE EARTHLY HEAVEN, before the TABLE OF CONTENTS.]
Why apply the formulas at all?
The purpose is the one set at the very beginning: redemption, which begins with awareness. So the values in the following Parts are not marks handed out to societies; they are mirrors, not verdicts. A mirror does not accuse the one who looks into it; it only shows what is there, so that what needs to be put right can first be seen. No specific person is named and no society is singled out, so that the focus stays on the system itself, and not on personal conflicts or on the inclinations one already holds. No society is called better or worse in these pages, and no people are blamed. Where a group appears (e.g. the richest 1%), it appears only as a measured group, never as a list of persons, just as Stolen Participation is to be reported for groups first (see THE UNJUSTIFIED BURDEN AND ITS IMPLICATIONS), so that no one carries a wrong label. And a value that can be measured can also be watched: a society that knows its value this year can see next year whether it has moved towards its reference point or away from it.
Why these seven societies?
The seven were not picked for being rich or poor, near or far, friendly or unfriendly. They were picked by one plain criterion, fixed before any of the formulas was applied to them: from each of the seven regions into which the World Bank has long divided the world, take the country with the most people. In this way every major region of the world is present once, and only once, and the choice itself could not lean towards any result.
| World Bank region | Society | People in 2025 (millions) | Share of the world |
|---|---|---|---|
| South Asia | India | 1,463.9 | 17.8% |
| East Asia and Pacific | China | 1,406.6 | 17.1% |
| North America | United States | 341.8 | 4.2% |
| Sub-Saharan Africa | Nigeria | 237.5 | 2.9% |
| Latin America and the Caribbean | Brazil | 212.8 | 2.6% |
| Europe and Central Asia | Russia | 143.5 | 1.7% |
| Middle East and North Africa | Egypt | 118.4 | 1.4% |
| The seven together | 3,924.5 | 47.8% |
Sources: see the Sources list, opening part.
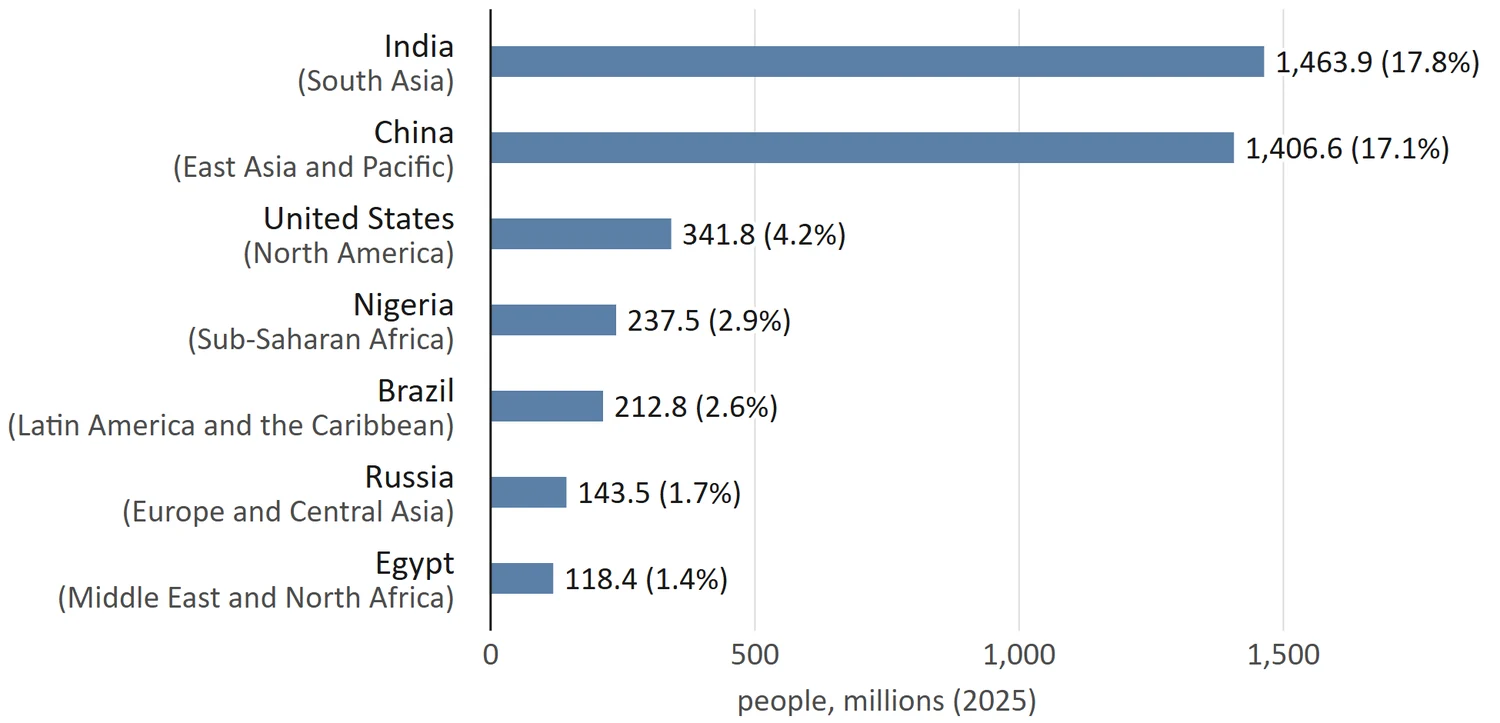
Chart 9: The seven societies and their people. The most populous country of each of the seven World Bank regions, by its number of people in 2025.
Together, these seven are home to nearly half of humanity: about 48 of every 100 people alive in 2025. They differ in size, income, climate and way of life, which is exactly what a fair test needs: if the steps of a formula hold across societies so unlike one another, they can be followed for almost any other. (Where a value could not be worked out from public data, as for one of the seven in Part 1, this is said plainly rather than filled with a guess.)
(The seven follow the World Bank's long-standing grouping of the world into seven regions, and the most populous country of each. Since July 2025, the World Bank's grouping joins two more countries to Egypt's region, and Egypt is then no longer its most populous country; the seven keep the long-standing grouping, which was fixed before any result was known.)
What is a "society" here?
A society is a bunch of stretched chains: individuals tied into groups, and groups into one whole, at every size from a family up to the dealings of one society with another. To measure, one size had to be chosen, and here it is the country, for a practical reason: nearly all public statistics on work, income, food, energy and health are published country by country, so the country is the society that any reader can measure and check from public data.
Two limits follow. A country holds many groups and regions, and one national value is an average that can hide large differences inside it (this is why Part 2 looks at groups). And societies are tied to one another by trade, so part of what one society uses is made by the work of another; Part 1 counts exactly this.
The measurements use the latest year that each public source covered, mostly between 2020 and 2025. Part 1 uses 2020, the latest year of the international table that traces the hours of work contained in trade; Part 2 uses 2024; Part 3 uses mostly 2023 to 2025; Part 4 uses giving in 2025, a values survey carried out between 2017 and 2022, and the change in burden from 2010 to 2022; Part 5 uses 2023 to 2025. Each Part names its own years.
How the results are shown
Each formula gives one final value for each society. Beside every value stand the reference points, i.e. the marks set where each value is explained. The formulas are applied exactly as written; where the text leaves a choice open (e.g. the unit of the preference gradient, or the standard against which the stress on nature is scored), the choice made is stated in its Part.
| Part | What is measured | The final value | The reference point |
|---|---|---|---|
| 1 | Participation to Burden ratio of a society | hours of NEP work ÷ hours of work contained in all that is consumed (the middle of a narrow range) | 1 = participation equals burden; between 0 and 1 = not self-sufficient |
| 2 | Participation to Burden ratio of an individual | the ratio of the richest 1%, as one group | above 0 = inside the green boundary; 0 = on the brink; below 0 = negative |
| 3 | Worth level | the overall worth level: the hours that the capable adults give to the NEPs, per capable adult (the work of the worthless not counted), read against the set point, the hours needed | above the set point = spare participation; close to it = on the edge; below it = under stress |
| 4 | Respect value | preference gradient × worth level (read as a share of the set point) | 1 = a world-average preference gradient where the hours given to the NEPs equal the hours needed |
| 5 | Efficiency level of natural resources, and the VIL | VIL depth: the share of the provision of the needs resting on resources that do not satisfy the green check | 0% = no need rests on such a resource |
Sources: see the Sources list, opening part.
Nothing here labels the societies: each value is set beside its reference point, and the reading is left to you. To make that reading easy, the seven are listed in every results table in the order of their values, and every chart draws the reference point as a line, so that you can see at a glance where each society stands.
How to read each Part
Parts 1 to 5 each take one formula and walk through the same seven steps, in the same order:
· The formula as written, quoted word for word.
· What it measures, in plain words, with a small example.
· How it was measured: which public data stands for each term, and why.
· A worked example: one society, start to finish, every number shown.
· The results for the seven: one table and one simple chart.
· Calculating it for any other society: a short worksheet to fill in.
· Limits: what the value cannot show.
Part 6 then sets all five values side by side, shows how they connect, and gives a short roadmap for working out all five for any society.
Where the full work used heavier tools (e.g. thousands of repeated trial calculations to test how firm a result is), each Part gives the simple core calculation, which a calculator or a simple spreadsheet can repeat, and says in a sentence or two what further checks were run.
No source is cited inside the running text, so that the reading stays plain. Every table and chart points to the Sources list at the end of this section, where each source is given in full, Part by Part, for any reader who wishes to check a number at its root.
Now, let us begin with the first formula: what a society gives, and what it takes.