
The formula as written
The rule (ARE YOU A WORTHFUL PERSON?):
“An individual must be assigned a worth level in accordance with his participation in the society.”
The worth level of a whole society, and what it signifies:
The overall worth level of a society is the total hours that its capable adults give to the NEPs (the work of the worthless, i.e. the extrinsic non-ideals, not being counted, as their burden overrides it), divided by the number of its capable adults. It is read against the required set point, i.e. the hours needed from each capable adult to cover the NEPs: if it is above the set point, the society has spare participation, enough to accommodate its non-ideals and to endure stress; if it is close to the set point, the society is on the edge; and if it falls below the set point (as extrinsic non-ideals increase), the society comes under stress, with more and more of its burden carried by forced worthfuls.
The individual, and the way the set point is fixed in practice:
(An individual's worth level is the hours he gives to the NEPs, and theirs rises above the required set point in proportion to this excess; for example, where the set point is 30 hours a week, a person who gives 45 hours a week to the NEPs carries one and a half times the required participation.) (In practice, the required participation level can be fixed as the total hours that the society needs to cover its NEPs, divided by the number of its capable adults; the overall worth level is then reported along with the share of individuals below the set point.)
Worth level of a society = NEP work hours of its capable adults (the work of the worthless not counted) ÷ number of its capable adults
Set point = total hours the society needs to cover its NEPs ÷ number of its capable adults
What it measures, in plain words
The worth level is the work that a society's capable adults actually give to the NEPs, in hours, per capable adult. The set point is the work in the NEPs that the society needs from each of its capable adults so that the NEPs of all its members, including those who cannot work, are met. The two are read side by side: hours given above the hours needed mean spare participation; close to them, the edge; below them, stress.
To understand this, let's take an example of a farming household of six: four capable adults, a small child and a grandmother. Growing its food, fetching its water, cooking, cleaning and caring take 120 hours of work a week, so the set point is 120 ÷ 4 = 30 hours for each adult. The mother, who gives 45 hours, carries one and a half times the required participation; the son gives 30, exactly the set point. The child and the grandmother are not capable adults; they are assigned a normal worth level (see below).
Now suppose that the four give 108 hours a week in all. Their worth level is 108 ÷ 4 = 27 hours each, and this work grows only nine-tenths of what the household needs. With the same tools, the whole need would take 108 ÷ 0.9 = 120 hours, i.e. 30 hours from each adult. So the household gives 27 hours against 30 needed: it is below its set point. This is how the set point of a whole society is found here: from how much of each NEP its own work produces. We call this share the production adequacy (is enough of each need produced or provided for everyone?).
If a part of the harvest is carried off before it reaches the table, the four have still worked as hard; what is missing is not work. The same line holds here: the forced worthful counts as worthful although his output is taken away:
The system in place sets false progress standards, i.e. wealth as the measure of success; a person who accepts such a standard tries to become wealthy, but in that very struggle he is made to participate more and more, while what he produces is drawn out of the societal pool through that very system (see Stolen Participation).
and, for a society, it keeps producing enough apart from receiving enough:
Similarly, if the value is near or equal to 1 but there is still a large deficit in the basic resources, then this can be a sign of external leeching (i.e. such a society produces enough, but its resources are drawn away by a dominant one).
So the worth level counts the work done. The part of the needs that is produced but does not reach the people, which we call the drain, is shown beside it and not subtracted from it; otherwise the people who did the work would be counted as if they had not participated.
How we measured it
The worth level: hours given to the NEPs
Only work in the NEPs counts:
Note: Their excess participation is in accordance with NEPs; as discussed before, any other participation is not considered while assigning the worth level.
To know whether a task is Natural Participation, just ask whether the society would suffer in any of its NEPs if that task were stopped; if yes, it is Natural Participation (e.g. a farmer, a builder, a teacher, a doctor, a soldier), and if not, it is a surplus play (e.g. luxury fashion, entertainment beyond relief, speculative trading).
Paid NEP work is the number of jobs multiplied by the usual weekly hours in farming, forestry and fishing; food, textile, clothing and leather factories; power, water and waste; construction; public administration and defence; security services; education; health and care; and household service. Unpaid NEP work is the cooking, cleaning and caring done at home, taken from time-use surveys (in which people record what they did through the day). Capable adults are everyone aged 15 to 64; jobs held by older people are left out so that the two match. The unit is hours a week per capable adult. Every hour counts as one hour, whether its work is mostly physical or mostly mental: an hour of a teacher, a planner or an administrator counts the same as an hour of a farmer or a builder (the Work-Position Similarity Theory, quoted in Part 2).
Children and the old: how they are counted
Note: Intrinsic non-ideals are assigned a normal worth level.
The intrinsic non-ideals include:
Children, old persons, the disabled from birth etc.
So everyone under 15 and everyone over 64 is not among the capable adults; they are not part of this count and keep their normal worth level.
The richest 1%: how they are counted
Exception: Extrinsic non-ideals should be regarded as worthless (especially ones with a negative participation to burden ratio, i.e. worth level is either zero or positive, while a negative worth level does not exist for participation-related cases).
The only such group that public data can pick out is the richest 1% of capable adults, whose individual ratio is below zero in all seven societies (Part 2). Their work is not counted, while they stay in the number of capable adults; as their own hours in the NEPs are not measured, the average share is left out (1 percent of the hours). This is a calculation step: the treatment of the extrinsic non-ideals in the worth level, applied to a measured group. It is not a judgement of any person in that group, and it names or places no one.
Worth level = 0.99 × NEP hours per capable adult
The set point: from production adequacy in six domains
For each domain, a public figure shows how much of the need the society's own work produces or provides. Each is counted up to the need (1) and not beyond, as output beyond the need does not serve the society's own NEPs; food is the one exception (next). The production adequacy is the plain average of the six.
| Domain | Public figure used | Counted as enough (1) when | Link to the NEPs |
|---|---|---|---|
| Food | Food energy grown at home ÷ food energy needed | the need is grown | food, the first of the Needs |
| Health workers | Doctors, nurses and midwives per 10,000 people | 44.5 or more (the WHO minimum) | the doctor, an example of Natural Participation |
| Water | Share using at least basic drinking water | 100% | with food among the Needs |
| Sanitation | Share using at least basic sanitation | 100% | part of a safe shelter |
| Electricity | Share with access to electricity | 100% | shelter and organization by today’s means |
| Teachers | Pupils per teacher, primary school | 40 or fewer | the teacher, an example of Natural Participation |
Set point = NEP hours given per capable adult ÷ production adequacy
Food grown beyond the need: counted partly
Food grown beyond the need is counted only in part. First, only the part that goes to others counts (food sent out beyond what is brought in, as a share of the need); food that a society eats beyond its need, or wastes at home, is its own artificial burden, not spare participation. Second, of that part, only the share of crop calories that ends up as food for people counts, not the share fed to animals or turned into fuel. Third, it counts only where the society gives more NEP work to other societies than it draws from them, counted in hours (farming, forestry and fishing, food processing, textiles and clothing): food sent out with few hours of work, while more hours of other people’s NEP work are drawn in, is not spare participation.
Food counted = 1 + (production ÷ domestic supply − 1) × (supply ÷ need) × (share of crop calories that feeds people)
This applies where a society grows more than its need, sends out more food than it brings in, and gives more NEP work to other societies than it draws from them; otherwise food counted = food grown ÷ need, up to 1.
| Society | Food grown ÷ need | Sent out, share of need | Share that feeds people | NEP work given (+) or drawn (−), net, hours a week per capable adult | Food counted |
|---|---|---|---|---|---|
| Russia | 2.11 | 0.66 | 0.59 | −0.7 | 1.00 |
| Brazil | 1.97 | 0.59 | 0.49 | +1.3 | 1.29 |
| United States | 1.74 | 0.20 | 0.34 | −4.1 | 1.00 |
| India | 1.18 | 0.015 | 0.91 | +1.1 | 1.01 |
| China | 1.13 | 0 (brings in more) | – | +0.9 | 1.00 |
| Nigeria | 0.98 | 0 | – | not in the trade tables | 0.98 |
| Egypt | 0.91 | 0 | – | −0.3 | 0.91 |
Sources: see the Sources list, Part 3.
The drain and the share below the set point
Drain = production adequacy over five domains (food, health workers, water, sanitation, electricity; each counted up to 1) − coverage
Coverage is the average of five figures of what actually reaches people, each divided by 100: for food, the average of the share who are not undernourished (they get enough calories) and the share who are not food insecure (in their own experience they have enough to eat), both from FAO; the shares using at least basic water, at least basic sanitation and electricity; and the health service coverage index (a 0 to 100 score of how far people receive the basic health services they need). So that the two sides are compared over the same needs, the production side of the drain takes the same five domains, i.e. the six domains of the worth level without the teachers, for whom no figure of what reaches people is used here. Water, sanitation and electricity cannot be sent away, so for them what is built is what reaches people. A drain of 0 means that everything produced for the needs reaches the people.
For the share below the set point, the capable adults are divided into six groups (women and men, each with an NEP job, with another job, or without paid work); each group's NEP hours are set against the set point, and the people in the groups below it are counted.
A worked example: India
Step 1, food. Calories grown ÷ calories supplied at home = 1.013 (2023). Food energy supplied ÷ needed = 1.16 (116%, 2023–2025). Food grown ÷ need = 1.013 × 1.16 = 1.175. Sent out, as a share of the need = (1.013 − 1) × 1.16 = 0.015. Share of crop calories that feeds people = 5.9 ÷ 6.5 = 0.908. Food counted = 1 + 0.015 × 0.908 = 1.014.
Step 2, the other domains. Health workers: doctors 0.723 + nurses and midwives 1.720 = 2.443 per 1,000 (2020), i.e. 24.43 per 10,000; 24.43 ÷ 44.5 = 0.549. Water 95.7% = 0.957; sanitation 83.4% = 0.834; electricity 99.9% = 0.999 (all 2024). Teachers: 32.7 pupils per teacher (2017); 40 ÷ 32.7 = 1.22, counted as 1.000.
Step 3, production adequacy = (1.014 + 0.549 + 0.957 + 0.834 + 0.999 + 1.000) ÷ 6 = 5.353 ÷ 6 = 0.8922.
Step 4, NEP hours. Women aged 15 to 64 (482.7 million) give 48.6 hours a week to NEP work (11.1 paid, 37.6 unpaid); men (519.0 million) give 25.1 (20.2 paid, 4.9 unpaid). The average per capable adult is 36.42 hours.
Step 5, the worth level: the work of the richest 1% is not counted, so 0.99 × 36.42 = 36.06, i.e. 36.1 hours a week per capable adult.
Step 6, set point = 36.42 ÷ 0.8922 = 40.82 hours a week needed from each capable adult.
Step 7, India's capable adults give 36.1 hours a week against 40.8 needed: below the set point.
Step 8, share below the set point (each group's hours against 40.82):
| Group | People (millions) | NEP hours a week |
|---|---|---|
| Women with an NEP job | 132.4 | 69.1 |
| Women with another job | 29.1 | 28.8 |
| Women without paid work | 321.2 | 42.0 |
| Men with an NEP job | 250.7 | 46.4 |
| Men with another job | 150.3 | 4.6 |
| Men without paid work | 118.0 | 5.8 |
Below 40.82 hours: 29.1 + 150.3 + 118.0 = 297.4 million of 1,001.7 million, i.e. 30%.
Step 9, drain. Food reaching people = (90.2% not undernourished + 65.1% not food insecure) ÷ 2 = 77.65%, i.e. 0.7765 (FAO does not publish India's food insecurity, so the value of Southern Asia, 34.9%, is used). Coverage = (0.7765 food + 0.957 + 0.834 + 0.999 + 0.690 health service index) ÷ 5 = 4.2565 ÷ 5 = 0.851. Production over the same five domains, with food counted up to 1 = (1.000 food + 0.549 health workers + 0.957 + 0.834 + 0.999) ÷ 5 = 4.339 ÷ 5 = 0.868. Drain = 0.868 − 0.851 = 0.017, i.e. 0.02.
The results for the seven societies
| Society | Worth level (hours of NEP work a week per capable adult) | Set point (hours needed a week per capable adult) | Capable adults below the set point |
|---|---|---|---|
| India | 36.1 | 40.8 | 30% |
| United States | 32.6 | 33.0 | 55% |
| Egypt | 32.5 | 36.4 | 34% |
| Nigeria | 32.5 | 45.1 | 85% |
| China | 32.2 | 32.9 | 66% |
| Russia | 30.9 | 31.8 | 55% |
| Brazil | 25.6 | 25.0 | 70% |
Sources: see the Sources list, Part 3.
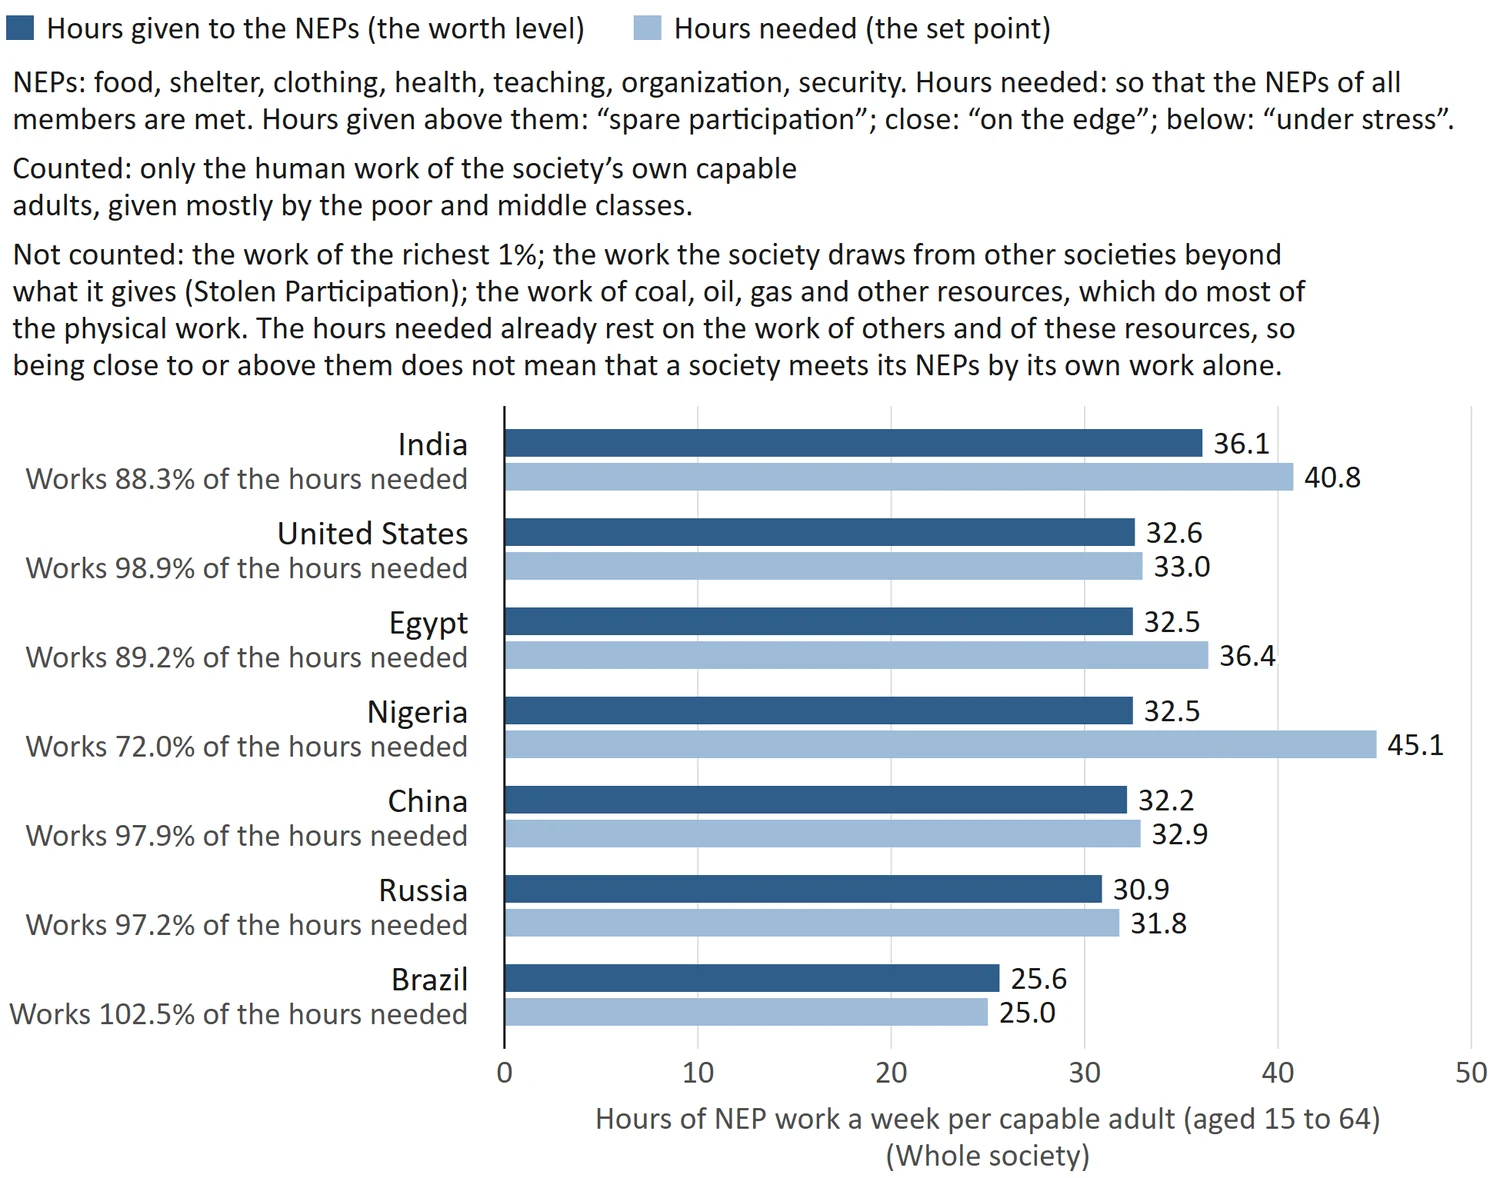
Chart 14: The worth level of the seven societies. The worth level of each society, in hours of NEP work a week per capable adult, with its set point, the hours needed, beside it. Both count only the human work of the society's own capable adults, not the work it draws from others or that coal, oil, gas and other resources do; they are given mostly by the poor and middle classes.
The reference points are: above the set point, spare participation; close to it, on the edge; below it, under stress, with more of the burden carried by forced worthfuls. Brazil gives a little more than its set point (25.6 hours against 25.0), a small spare participation that comes from the food it sends to others (counted partly, as above; with no food surplus counted, it would not reach its set point). The United States gives 32.6 hours against 33.0 needed, China 32.2 against 32.9 and Russia 30.9 against 31.8, all close to their set points; the United States and Russia send food to others too, but they draw more NEP work from other societies than they give, so their food beyond the need is not counted (as above). Nigeria gives 32.5 hours against 45.1 needed (about seven-tenths), Egypt 32.5 against 36.4, and India 36.1 against 40.8. A low worth level alone does not mean that the breaking point has been reached; it is read together with the respect value (Part 4).
These hours are strictly human work in the NEPs, given by the society's own capable adults, and the hours needed are counted in the same way. A society's NEPs are also met by work that neither value counts: the hours of other people's work that it draws from other societies beyond the hours it gives to them (Stolen Participation; the hours inside everything a society uses, wherever they were worked, enter the ratio of Part 1), and the work done by coal, oil, gas and other resources, which do most of the physical work. The hours needed are the hours needed with all this help; without it, more of the society's own hours would be needed (Part 5 shows how many more if those resources vanished). So hours given close to or above the hours needed do not mean that a society meets its NEPs by its own work alone. This holds for every value here.
Who gives these hours? Mostly the poor and middle classes (the poorest half and the middle 40%, as in Part 2), who are about nine-tenths of the capable adults; the work of the richest 1% is not counted at all (see above). More than half of the hours in every society here (54% to 68%) are unpaid work at home: cooking, cleaning and caring. Better-off homes hand part of that work to paid household workers, who are among the lowest-paid of all: their pay is a third to two-fifths of the average pay in four of the seven societies (0.33 to 0.41 of it) and 0.80 of it in one more (there are no figures for the other two). Those with more schooling also do less of it themselves: in the one society with figures by schooling, 15.4 hours a week for those with a university degree against 18.0 for those who did not finish primary school, and for women 18.0 against 23.3. Paid NEP work, taken as a whole, is paid at about the average or below (0.97 to 1.03 of the average pay of employees in three of the five societies with figures, 0.67 and 0.80 in the other two), and farming is paid below the average in all seven (0.53 to 0.97 of it). Some NEP work, such as that of doctors and senior officials, is done by people in the richest tenth, so the hours come mostly, though not only, from the poor and middle classes.
The hours given to the NEPs are close to one another (25.6 to 36.1 a week per capable adult); the set points differ much more (25.0 to 45.1). So where needs go unmet, it is not because people work less: Nigeria's capable adults give 32.5 hours a week to the NEPs, about as many as those of the United States (32.6). What differs is what each hour yields for the society's own needs. It yields more where machines and fuel do part of the work (see Part 6), and less where part of what the society has goes to others: Nigeria pays out part of its income abroad every year, and about one in six of the doctors it trained works in a rich country. The six domains show where each set point comes from:
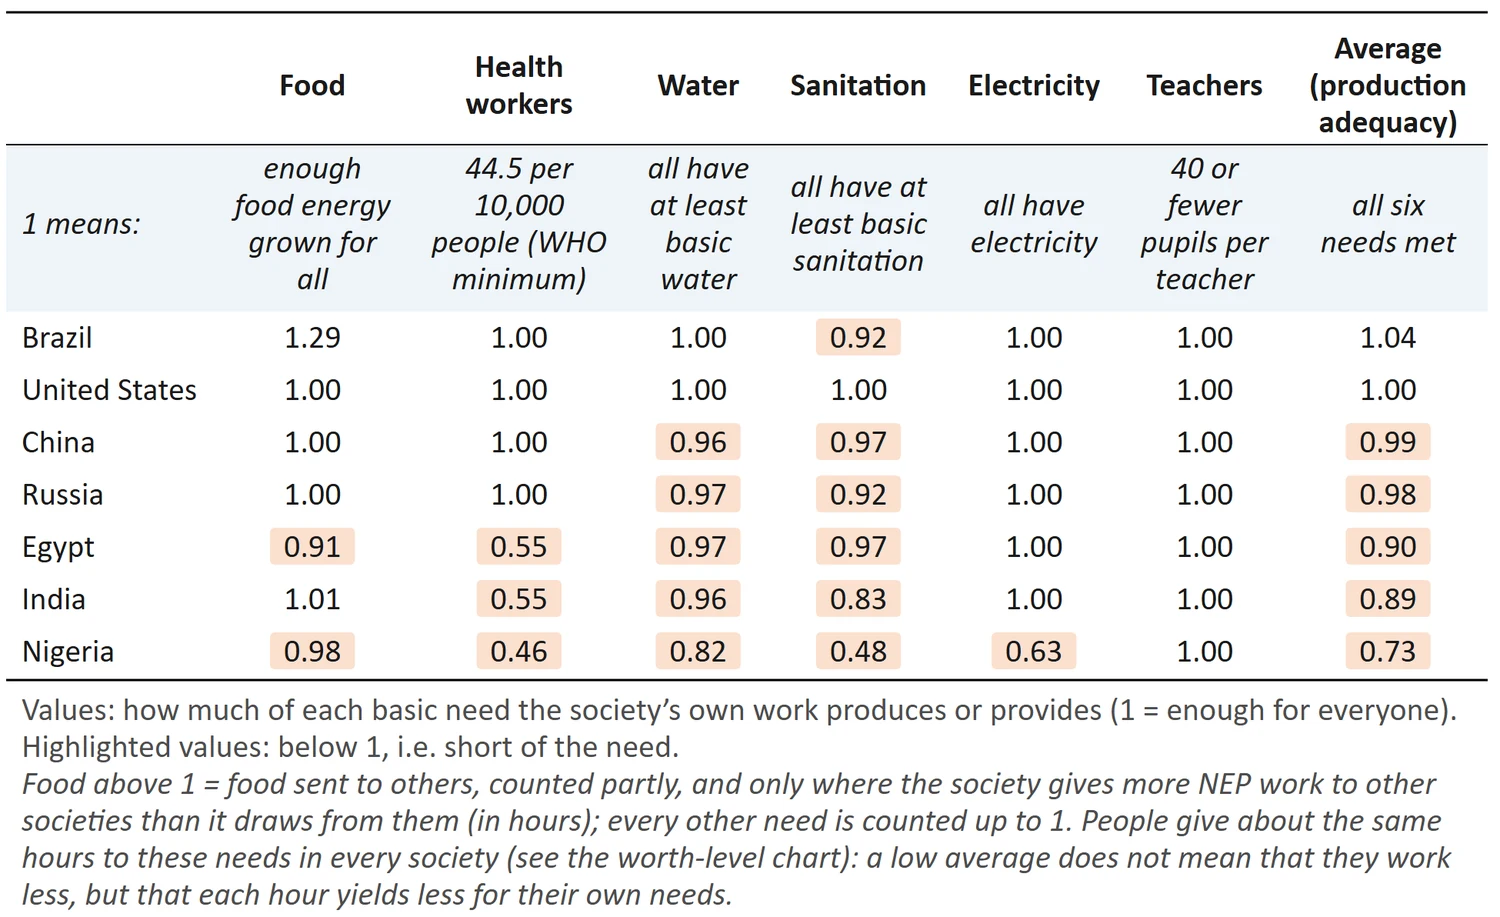
Chart 15: The six domains of the production adequacy. For each society, how much of each need its own work produces or provides (1 = enough for everyone), and their average, the production adequacy, from which its set point is found.
Health workers stand at 0.46 to 0.55 of the WHO minimum in three societies. At least basic sanitation reaches 48% of the people in one society, 83% in another, and 92% to nearly all in the other five. Electricity reaches 62.5% of the people in one society and all or nearly all in the other six. The teachers' standard is met in all seven.
The drain is 0.09 in Nigeria, where the food grown is 0.98 of the need while 22% of the people are undernourished and 77% are food insecure (0.04 if only calories are counted, 0.15 if only people's own experience is). In the other six it is between −0.01 and 0.04 (Brazil 0.04, Russia 0.04, China 0.04, United States 0.04, India 0.02, Egypt −0.01).
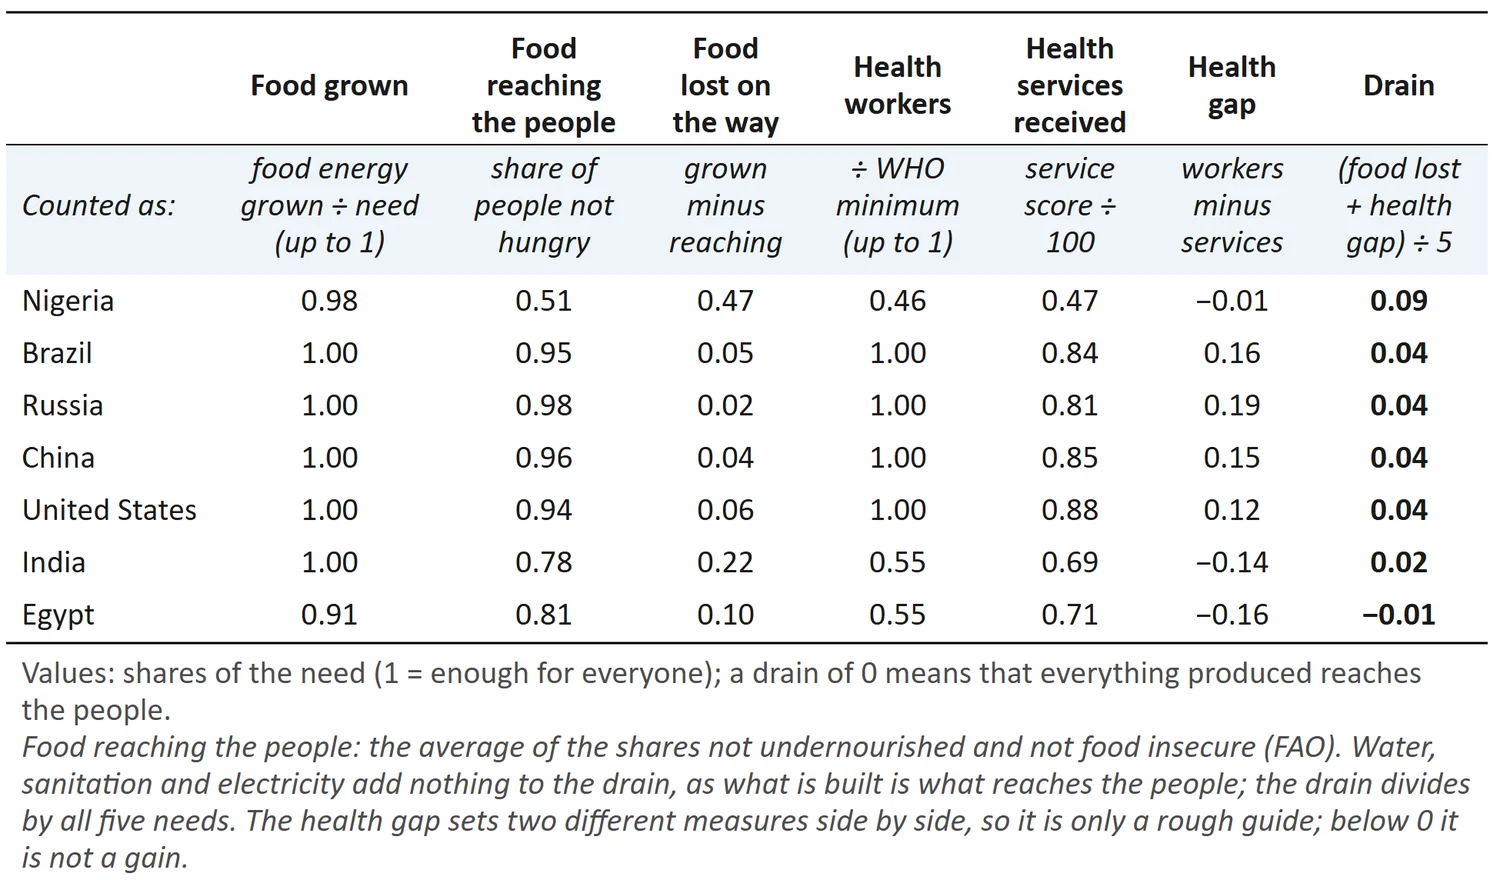
Chart 16: Needs produced but not reaching the people (the drain). For each society, how much of the food and health needs its own work produces, how much reaches the people, and the gap; the drain is the two gaps added and divided by the five needs; 0 means everything produced reaches the people.
The drain has two parts, as water, sanitation and electricity add nothing (what is built is what reaches the people); the two gaps are added and divided by the five needs. Food lost on the way is the food grown for the needs that does not reach the people: 0.47 of the need in Nigeria, 0.22 in India, 0.10 in Egypt and 0.02 to 0.06 in the other four. The health gap sets the health workers, as a share of the WHO minimum, against the health services people receive (a score from 0 to 100). These are two different measures, so the health gap is only a rough guide. In Russia, Brazil, China and the United States it is most of the drain (0.12 to 0.19): their health workers meet the minimum, while the services score 0.81 to 0.88. In Egypt and India it is below zero (−0.16 and −0.14), as the services score higher (0.71 and 0.69) than the health workers reach (0.55 of the minimum); this is not a gain. So Egypt's drain is below zero because of the health gap alone; its food lost on the way is above zero (0.10), as it grows 0.91 of its food need while 0.81 reaches its people.
Calculate it for any other society
The data (full names and addresses in the Sources list, Part 3):
· ILOSTAT: jobs by economic activity (DF_EMP_2EMP_SEX_ECO_NB) and mean weekly hours actually worked by economic activity (DF_HOW_TEMP_SEX_ECO_NB); jobs by age, to leave out those held by people aged 65 and over.
· Unpaid domestic chores and care work, by sex (SDG 5.4.1, national time-use surveys): BLS American Time Use Survey 2025, Table 1 (United States); World Bank WDI SG.TIM.UWRK.FE and SG.TIM.UWRK.MA (Brazil, China); UN SDG Global Database, SL_DOM_TSPD (Russia, India).
· World Bank WDI: SP.POP.1564.FE.IN and SP.POP.1564.MA.IN (women and men aged 15 to 64).
· FAOSTAT Food Balances, for every food item: Production (5511), Domestic supply quantity (5301), Food (5142), Food supply (kcal) (661).
· FAOSTAT Suite of Food Security Indicators: item 21010, average dietary energy supply adequacy.
· Share of crop calories that feeds people: Cassidy and others (2013), Table 2 (delivered ÷ produced); the world value 0.59 if the society is not listed.
· NEP work given and drawn: OECD Trade in Employment, 2023 edition, FFD_DEM for activities A, C10T12 and C13T15, year 2020 (your society's jobs serving buyers abroad, and the jobs in each other economy serving it), with the weekly hours of each economy (ILOSTAT, as in Part 1); net hours a week per capable adult.
· World Bank WDI: SH.MED.PHYS.ZS and SH.MED.NUMW.P3 (doctors; nurses and midwives, per 1,000); SH.H2O.BASW.ZS (basic water); SH.STA.BASS.ZS (at least basic sanitation); EG.ELC.ACCS.ZS (electricity); SE.PRM.ENRL.TC.ZS (pupils per teacher, primary).
· For the drain: FAOSTAT Suite of Food Security Indicators, items 210041 (prevalence of undernourishment) and 210091 (moderate or severe food insecurity), three-year averages (also in WDI as SN.ITK.DEFC.ZS and SN.ITK.MSFI.ZS); World Bank WDI: SH_UHC_SCI (health service coverage index, SDG 3.8.1).
The steps:
1. NEP hours per capable adult = (jobs in the NEP fields × their weekly hours, without jobs of people aged 65 and over) ÷ people aged 15 to 64, plus unpaid home work in hours a week (share of the day × 168), averaged over women and men.
2. Worth level = 0.99 × step 1 (the work of the richest 1% not counted).
3. Food: for each item, calories per tonne = Food supply (kcal) ÷ Food. A = sum of (Production × calories per tonne) ÷ sum of (Domestic supply quantity × calories per tonne). B = item 21010 ÷ 100. If A is above 1, A × B is at least 1 and the society gives more NEP work to other societies than it draws from them (in hours; see “NEP work given and drawn” in the data above), food = 1 + (A − 1) × B × share that feeds people; otherwise food = A × B, up to 1.
4. Health workers = (doctors + nurses and midwives per 1,000) ÷ 4.45, up to 1.
5. Water, sanitation, electricity = each percentage ÷ 100.
6. Teachers = 40 ÷ pupils per teacher, up to 1.
7. Production adequacy = average of steps 3 to 6 (six values).
8. Set point = step 1 ÷ step 7.
9. Read step 2 against step 8.
10. Drain = average of the five values for food (up to 1 only), health workers, water, sanitation and electricity − average of the five coverage figures ÷ 100.
| Step | What | Your society |
|---|---|---|
| 1 | NEP hours per capable adult (a week) | |
| 2 | Worth level (hours a week) | |
| 3 | Food counted | |
| 4 | Health workers | |
| 5 | Water / sanitation / electricity | |
| 6 | Teachers | |
| 7 | Production adequacy | |
| 8 | Set point (hours a week) | |
| 10 | Drain |
Limits
· What counts as NEP work, and each standard of "enough", is a judgement. Organization, security and care have no public standard of "enough", so they enter the hours but not the six domains. The choice of NEP fields moves the worth level and the set point together, so the reading of one against the other changes little.
· The teachers' standard is met in all seven, so it does not separate them; the latest pupil figures are from 2017–2018, and from 2010 in Nigeria.
· Only one group of extrinsic non-ideals, the richest 1%, can be picked out; any others are inside the capable adults, as are adults aged 15 to 64 who cannot work. The richest 1%'s own hours in the NEPs are not measured, so the average share is left out; if they give none, each worth level is up to 1% higher.
· The food count uses crop-use shares from about the year 2000, and the world value for Russia, Egypt and Nigeria. Counting no food surplus gives a production adequacy of 0.99 for Brazil (so a higher set point, and no society above its set point); counting all of it, also where more NEP work is drawn in than given, gives 1.12 for the United States, 1.01 for China, 1.17 for Russia, 1.15 for Brazil and 0.92 for India. Egypt and Nigeria do not change.
· Water and sanitation are both counted at the "at least basic" level, as every other domain is counted at a minimum standard (the WHO minimum of health workers, 40 pupils per teacher, access to electricity). The stricter "safely managed" level of sanitation is met nearly in full in only one society; counted at that level, the production adequacy of the other six would be 0.03 to 0.07 lower, and no society would reach its set point.
· The drain sets the calories grown against the people who are fed and who say they have enough to eat, and health workers against services received; it shows how much does not reach the people, not where it goes. FAO does not publish food insecurity for China and India, so their regions' values are used. Teachers are left out of it, as no figure of how far teaching reaches people is used. Time-use data are from 2018 in China and four states in Nigeria; Egypt's are from the 2023 Labour Market Panel Survey.
· Unpaid home work is measured by surveys of different kinds: time diaries in most of the seven, a direct question in Brazil's labour survey, and four states only in Nigeria. So the hours given and the hours needed are not fully comparable from one society to another. The share of the hours needed is not affected, as the same hours stand on both sides of it.
· How much of a society's lower yield per hour comes from less help of machines and fuel, and how much from what goes to others, is not measured here. The doctors working abroad are only a small part of Nigeria's shortfall of health workers: their return would add less than 1 to its 20 health workers per 10,000 people (doctors in 2023, nurses and midwives in 2022), against the 44.5 needed. The income paid abroad includes profit on real investment, which is allowed (see RESPONSIBILITIES FOR THE WEALTH).