
The formula as written
A second form of the Participation to Burden ratio, made for the individual to show destructiveness, is given in THE UNJUSTIFIED BURDEN AND ITS IMPLICATIONS:
Participation to burden ratio (individual) = (Self Participation + Stolen Participation) ÷ Artificial Burden
NOTE: STOLEN PARTICIPATION IS ASSIGNED A NEGATIVE SIGN; THIS IS FOR STANDARDIZATION AND CALCULATION PURPOSES.
Self Participation refers to both Natural and Artificial Participation.
Stolen Participation is in fact the Artificial Burden, but in the sense that Self Participation is comparatively minimal or simply none.
What it measures, in plain words
The ratio of the society (Part 1) asks whether a society's NEP work covers everything it uses. This ratio asks a closer question about the people inside it: when someone draws more than the NEPs require, who pays for that extra, his own work or the work of others?
Self Participation is the work a person does himself. Stolen Participation is the work of others that he draws beyond his own, i.e. the part of his Artificial Burden that his own work does not cover; with its minus sign, it cancels his own work hour for hour. The Artificial Burden, below the line, is the part of his draw that lies beyond the NEPs. So the value is read in two divisions: his own work against his Artificial Burden, and then the work he draws from others against the same Artificial Burden, with its minus sign; the two are added.
To understand this, let's take an example of three shopkeepers in one street. Each draws 100 hours of other people's work a month, and 50 of these would cover his NEPs, so each has an Artificial Burden of 50. The first works 100 hours at his counter, so his own work covers all he draws: (100 − 0) ÷ 50 = 2. The second works 50 hours and draws the other 50 from others: (50 − 50) ÷ 50 = 0. The third works 20 hours and lets others carry the rest, so the whole of his Artificial Burden is drawn from others: (20 − 50) ÷ 50 = −0.6. All three live alike; the ratio tells them apart only by whose work pays for their extra.
This gives a quick way to read the value. When the draw is far above the NEPs, the value is very close to twice the share of the draw that one's own work covers, minus 1. It falls below zero as soon as one's own work covers less than half of what one draws, and it nears −1 when one's own work covers almost none of it.
How we measured it
Groups, not persons
First, how it is to be measured:
(In practice, Stolen Participation can be measured by splitting the resources an individual draws into what is earned by his work and what is drawn without work (e.g. income from houses and land, and unearned gains); it should first be reported for groups rather than as personal scores, as a wrong label harms an innocent individual.)
This agrees with the aim stated at its opening:
The priority is not to mention individuals specifically while unveiling the oppressive system, but rather to make people aware of their wickedness so that the goal of redemption can be achieved.
So no person is measured here. Each value belongs to a group of adults defined only by its place on the income ladder of its own society: the poorest half (bottom 50%), the middle 40%, the next 9% and the richest 1%. A group's value is the value of its average member.
The unit: hours of human work
Both participation and burden are measured in the same unit, i.e. the net work done: participation is the work an individual contributes towards the NEPs, and burden is the work of others that he draws from the societal pool in the form of resources
So every amount here is counted in hours of human work, per adult, per year. Money is not used as a measure: high pay is not the same as much work, and the same money buys very different amounts of work in different societies (in one of the seven, the same sum buys about twenty times more hours of work than in another). Money appears only as a share inside one society, e.g. a group's share of its society's income, where the currency cancels out.
Work here is not only physical work. The Work-Position Similarity Theory states:
In an ideal society, the individuals are assigned the same amount of work (quantitatively) (burden), irrespective of the position they bear (in terms of level).
As we move from lower to upper levels, physical struggle decreases while mental/psychological struggle increases, but the net product is the same.
So an hour of work is counted as one hour whether it is mostly physical or mostly mental: an hour of a manager, a teacher or a planner counts the same as an hour in the field or the workshop. The hours of the richest 1% are therefore counted in full, their mental work included.
Burden: the hours of others' work a group draws
First, the hours of work contained in everything the society uses in a year, per adult, are taken from Part 1: the hours its people work, divided by the ratio of hours worked to hours contained in what the society uses (in Brazil, 1,203 hours per adult a year). Then each group's share is found. Public services (schools, clinics, roads, defence) are shared equally by every adult; the rest is divided by each group's share of the society's income after taxes and transfers. Whatever a group receives counts as drawn, whether it is used at once or stored as wealth, because wealth is "a compressed form of the net work done" (see RESPONSIBILITIES FOR THE WEALTH).
Natural and Artificial Burden
If the burden is in accordance with the NEPs, then this is called natural burden, while if the burden is out of line with the NEPs, then this is called artificial burden.
The natural burden is counted in hours too, with no money at all. It is the paid NEP work that the society needs from each of its capable adults so that the NEPs of all its members are met: the paid hours its capable adults give to the NEP fields, divided by its production adequacy, the share of the need that its own work produces or provides (Part 3). In Brazil: 11.15 paid NEP hours a week ÷ 1.035 × 52 = 560 hours a year. Only paid hours are taken here, because the burden above counts only the paid work contained in what the society uses. Everything a group draws above it is Artificial Burden. A group whose draw lies at or below the natural burden has no Artificial Burden, and this is read as follows:
(If an individual has no Artificial Burden at all, there is nothing for this formula to measure: he is regarded as fully inside the green boundary, as destructiveness only arises where an Artificial Burden exists.)
Self Participation: the hours a group works
All work counts, NEP work and other work alike, as Self Participation refers to both Natural and Artificial Participation. The poorest half and the middle 40% are given the society's average paid hours per adult. For the next 9% and the richest 1%, every adult is counted as working full time at the weekly hours of employed managers in that society (International Labour Organization), more than most of them work. This is the reading most favourable to the top.
Stolen Participation: the hours drawn beyond one's own work
The part of the Artificial Burden that the group's own work does not cover: what it draws minus what it works, when that is above zero, and never more than the Artificial Burden itself. The natural burden is everyone's due, so it is never counted as stolen.
How the other tests confirm it
The calculation was repeated six ways: with all of a society's use divided by income (no equal share of public services); with income before taxes and transfers; with the top groups working only the average hours of their society; with unpaid home work added to the work of the poorest half and the middle 40%; with the money of the top commanding only half as many hours as the average money (much of what the rich buy is costly services and assets); and, for Nigeria, which is not in Part 1's tables, with the ratio of hours worked to hours used set at 0.9 and at 1.15. In every test, the richest 1% stayed below zero in all seven, between −0.50 and −0.93.
Counted in money instead, as pay received, one society's richest 1% had seemed close to the brink (−0.07), because very high pay was counted as very much work. Counted in hours, its managers' 2,148 hours a year stand against about 27,000 hours of others' work drawn.
A worked example: the richest 1% of Brazil
| Step | What is found | Calculation | Result |
|---|---|---|---|
| 1 | Hours of work contained in what the society uses, per adult a year | 25.88 paid hours per adult a week ÷ 1.1184 (Part 1) × 52 | 1,203.2 h |
| 2 | Share of public services in the society's use | government consumption ÷ gross national expenditure | 19.2% |
| 3 | Share of income after taxes and transfers, richest 1% | 22.16% of income for 1% of adults | 22.16 times the average |
| 4 | Burden of one adult of the richest 1% | 0.192 × 1,203.2 + 0.808 × 1,203.2 × 22.16 | 21,775 h |
| 5 | Natural burden | 11.15 paid NEP hours a week per capable adult ÷ 1.0352 (production adequacy, Part 3) × 52 | 560 h |
| 6 | Artificial Burden | 21,775 − 560 | 21,215 h |
| 7 | Self Participation | 42.96 hours a week (managers) × 52 | 2,234 h |
| 8 | Stolen Participation | 21,775 − 2,234 | 19,541 h |
| 9 | Ratio | 2,234 ÷ 21,215 + (−19,541 ÷ 21,215) = 0.105 − 0.921 | −0.82 |
(The last digits differ slightly by rounding; the calculation was carried out in full.) The quick reading comes close: 2 × (2,234 ÷ 21,775) − 1 = −0.79. In other words, each adult of Brazil's richest 1% draws in a year 19,541 hours of other people's work beyond his own, nearly nine times the 2,234 hours he works himself.
The results for the seven societies
The reference points:
| Value | What this value means |
|---|---|
| above 0 | "Individual case: As this value determines the destructiveness, a positive value specifies that the individual is inside the green boundary and is not a considerable threat to the society." |
| 0 | "The first case shows that the individual is on the brink and is vulnerable to becoming a destructive person sooner or later." |
| below 0 | "Individual case: Only possible if Stolen Participation overrides the Self Participation. The more negative the value is, the greater the destructiveness of the individual." |
(The "first case" of zero is where Self Participation and Stolen Participation are equal in magnitude.)
Table 1. The richest 1% of adults, in hours of work a year, from the highest value to the lowest
| Society | Final value | Range from the tests | Own work (hours) | Others' work drawn (hours) | Drawn beyond own work (hours) |
|---|---|---|---|---|---|
| Egypt | −0.76 | −0.92 to −0.50 | 2,427 | 18,218 | 15,791 |
| Nigeria | −0.76 | −0.86 to −0.50 | 2,080 | 14,609 | 12,529 |
| China | −0.77 | −0.85 to −0.53 | 2,527 | 19,307 | 16,780 |
| India | −0.79 | −0.93 to −0.56 | 2,973 | 24,379 | 21,405 |
| Brazil | −0.82 | −0.90 to −0.63 | 2,234 | 21,775 | 19,541 |
| United States | −0.86 | −0.92 to −0.71 | 2,148 | 26,966 | 24,819 |
| Russia | −0.87 | −0.91 to −0.73 | 2,071 | 26,969 | 24,899 |
The seven stand close together: in hours of work, the richest 1% everywhere draw between about 12,500 and 24,900 hours of other people's work a year beyond their own, while working about 2,100 to 3,000 hours themselves.
In Chart 11, the short bar on the green side is only the fair share of the richest 1%, the part of their draw that their own work earns. It does not mean that the group is inside the green boundary or is not destructive: only the value, the two parts added, is read against zero, and it is below zero in all seven. Each number in Chart 11 is rounded on its own, so the two parts may differ from the value by 0.01.
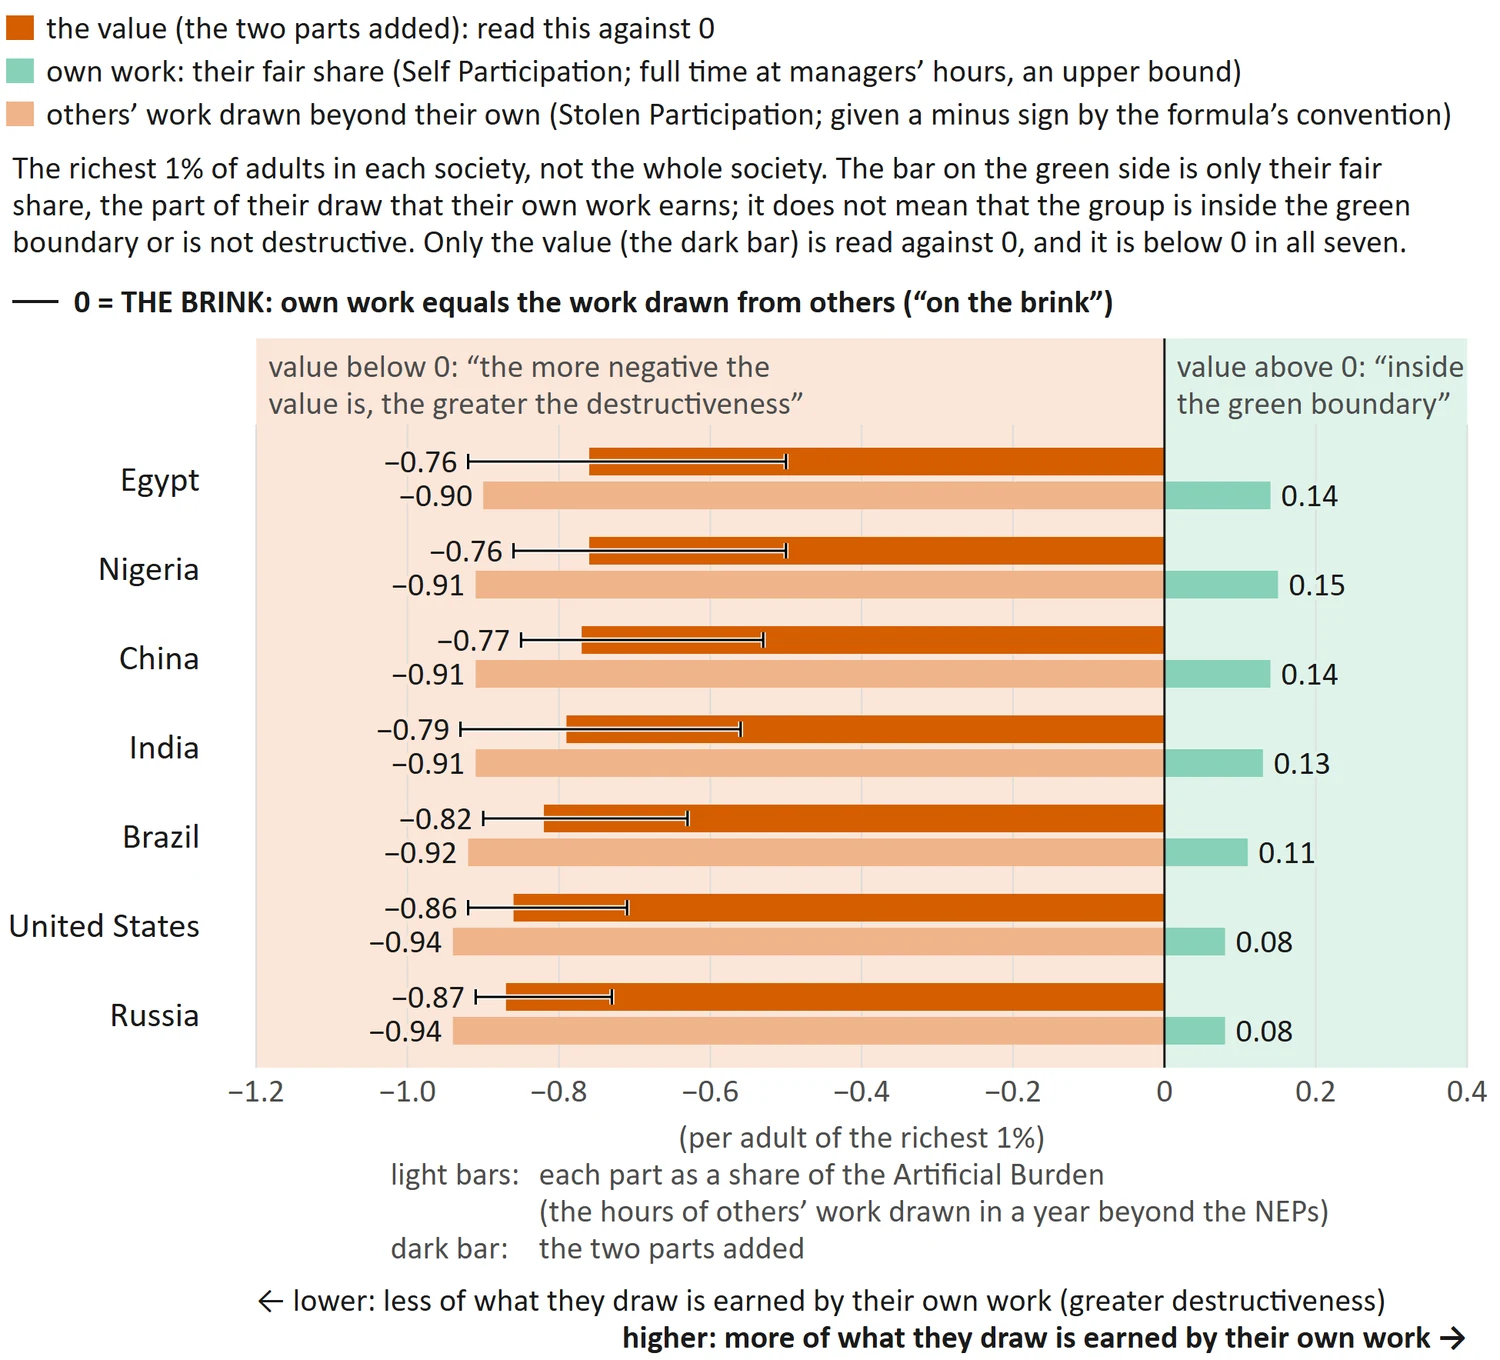
Chart 11: The richest 1%: Participation to burden ratio (individual), in hours of work. The final value for the richest 1% of adults in each of the seven societies, with the range from the tests; the line at zero is the brink.
Chart 11 shows the balance of own work and others' work; it does not show how much is drawn. Chart 12 shows the size: how many hours of other people's work each adult of the richest 1% draws in a year beyond his own.
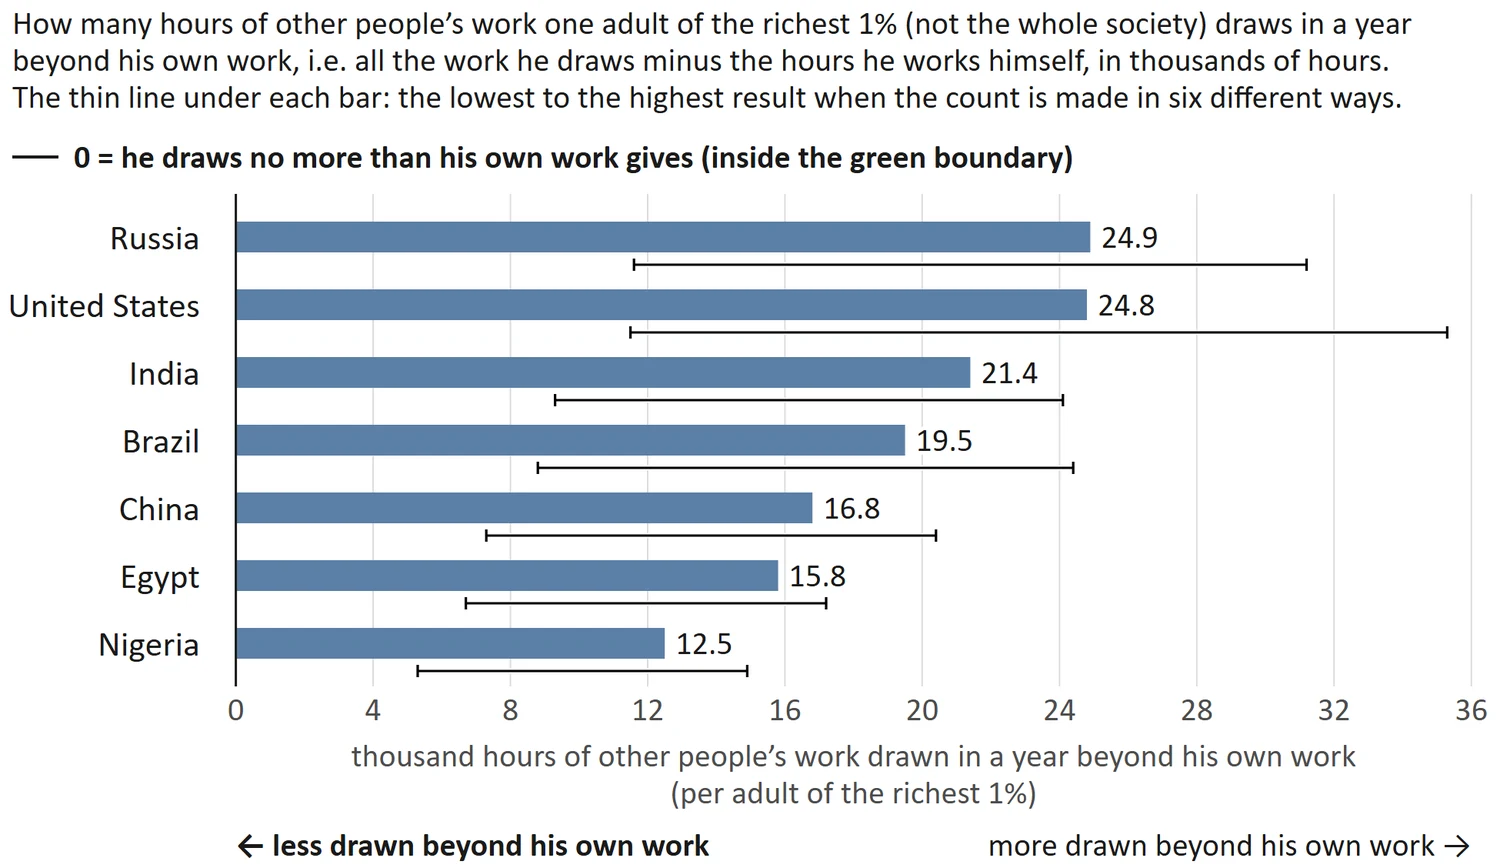
Chart 12: The richest 1%: others' work drawn beyond their own. The hours of other people's work that each adult of the richest 1% draws in a year beyond his own work, in thousands of hours, with the range from the tests.
Table 2. All four groups, in hours of work
| Society | Bottom 50% | Middle 40% | Next 9% | Richest 1% |
|---|---|---|---|---|
| Egypt | inside | 3.03 | 0.57 | −0.76 |
| Nigeria | inside | 2.23 | 0.00 | −0.76 |
| China | inside | 1.82 | 0.21 | −0.77 |
| India | inside | inside | 0.50 | −0.79 |
| Brazil | inside | 3.48 | 0.10 | −0.82 |
| United States | 3.18 | 0.41 | −0.11 | −0.86 |
| Russia | 22.57 | 2.35 | 0.16 | −0.87 |
"Inside" means the group's average draw lies at or below the natural burden, so it has no Artificial Burden and is fully inside the green boundary. Russia's poorest half draws only 67 hours a year above the natural burden, so its own work covers this small Artificial Burden many times over, hence the large value. The next 9% sits near zero and moves with the way the count is made (between −0.48 and +2.32 in the tests), so it gives no firm reading. The poorest half and the middle 40% include students, the old and those without work, so their values are indicative only.
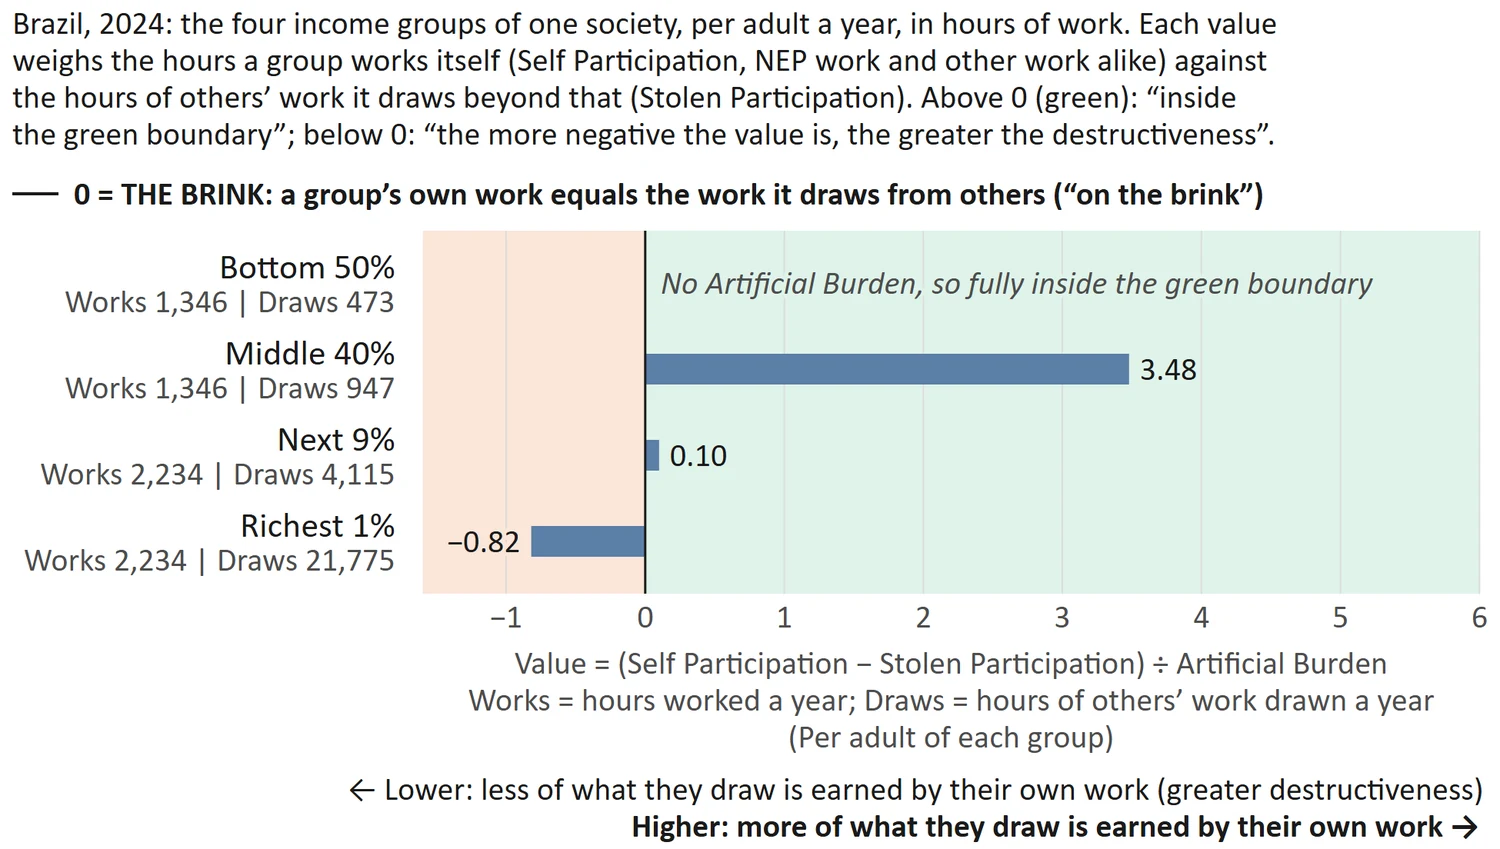
Chart 13: Four groups in one society: Brazil. The ratio of each income group in Brazil, in hours of work; the line at zero is the brink.
Table 3. Other sides of the same picture
| Society | Richest 1%: carbon, times the fair share (2019) | Wealth held offshore, % of the society's yearly output (2023) | Tax collected, % of net domestic product (2021) |
|---|---|---|---|
| Egypt | 13 | 21.7 | 15 |
| Nigeria | 4.3 | 8.9 | 7 |
| China | 70 | 10.7 | 25 |
| India | 17 | 2.0 | 18 |
| Brazil | 26 | 3.4 | 37 |
| United States | 104 | 8.5 | 32 |
| Russia | 91 | 15.7 | 31 |
The fair share of carbon is 1.9 tonnes a person a year, an equal share of what the world can still emit while keeping warming to 1.5 °C; the richest 1% of one society emit 198 tonnes each a year, two-thirds of it through what they own.
Calculate it for any other society
Data:
· From Part 1's worksheet: paid hours per adult a week (step 6) and the ratio R of hours worked to hours contained in what the society uses (step 3).
· From Part 3's worksheet: the paid part of step 1 (jobs in the NEP fields × their weekly hours, without jobs of people aged 65 and over, ÷ people aged 15 to 64, averaged over women and men) and the production adequacy (step 7).
· World Inequality Database (wid.world): sdiincj992, post-tax disposable income, share, groups p0p50, p50p90, p90p100 and p99p100 (next 9% = p90p100 minus p99p100).
· World Bank: NE.CON.GOVT.ZS (government final consumption) and NE.DAB.TOTL.ZS (gross national expenditure), both % of output.
· ILOSTAT: mean weekly hours actually worked by occupation, managers (ISCO-08 group 1).
Steps:
· H = paid hours per adult a week ÷ R × 52.
· Public share = government final consumption ÷ gross national expenditure.
· Burden of a group = public share × H + (1 − public share) × H × (income share ÷ the group's share of adults).
· Natural burden = paid NEP hours per capable adult a week ÷ production adequacy × 52 (Part 3).
· Artificial Burden = burden − natural burden; if zero or less, write "inside".
· Self Participation = paid hours per adult a week × 52 for the bottom 50% and middle 40%; managers' weekly hours × 52 for the next 9% and richest 1%.
· Stolen Participation = burden − Self Participation, if above zero (at most the Artificial Burden).
· Ratio = Self Participation ÷ Artificial Burden + (−Stolen Participation ÷ Artificial Burden).
| Group | Burden (h) | Natural burden (h) | Artificial Burden (h) | Self Participation (h) | Stolen Participation (h) | Ratio |
|---|---|---|---|---|---|---|
| Bottom 50% | ||||||
| Middle 40% | ||||||
| Next 9% | ||||||
| Richest 1% |
Limits
· The values belong to groups, never to persons, and many inside a group differ from its average. The numbers cannot show intention, so this Part places no one in the Societal Domains; Part 7 places groups, never persons, by their participation to burden ratio (see The societal domains).
· The hours each group works are not measured directly: the average for the bottom 90%, and for the top 10% an upper bound (full time at managers' hours).
· The natural burden is the paid NEP work needed from each capable adult (Part 3). Like the hours of work contained in what the society uses (Part 1), it is counted per capable adult, so both include the share of children and of those who cannot work.
· The top's money is taken to command as many hours of work as the average money; when it commands only half, the values move towards zero but stay below it.
· The hours contained in a society's use are for 2020 (Part 1's tables); income shares are for 2024. Nigeria is not in Part 1's tables, so its ratio of hours worked to hours used is taken as 1 and tested at 0.9 and 1.15.
· Years differ in Table 3: carbon 2019, offshore wealth 2023, tax 2021.