
The measure as written
In THE DESTINED FUTURE (HSPs), the Elastic limit of nature is first defined:
The maximum stress that can be accepted by nature before imparting lethal consequences that are either prolonged or virtually irreversible
For the intra-societal case, the Shock and Pad Theory gives its point of no return, its warning signs and its measure:
This point of no return refers to the Elastic limit for the intra-societal case. Just think of its warning signs: rising crime, the formation of rival dominating groups, a collapse of trust, and more and more people unable to meet their NEPs; its measure is the Participation to Burden ratio of the society, which falls towards zero as this point nears (see THE UNJUSTIFIED BURDEN AND ITS IMPLICATIONS).
The same paragraph then joins them into one value:
(In practice, these signs, along with the Participation to Burden ratio, can be combined into one warning index calculated every year; a sharp rise in this index warns that the elastic limit is near.)
What it measures, in plain words
In the chain picture, every violation of a major natural phenomenon makes a ring vibrate, and the shock travels along the chain. One vibrating ring can be calmed; when more and more rings vibrate, the chain is strained towards the point where it can no longer return to its shape: the elastic limit. The warning index is a yearly reading of that strain. It cannot see the shocks themselves, but it can see what they leave behind, and the four warning signs and the Participation to Burden ratio are those traces:
· Rising crime: people harming one another. Read from the killings counted each year (intentional homicides per 100,000 people), the crime counted most alike from country to country. Most crime is never reported, and so never counted; a killing is the crime least often lost from the count, which is why it is the one read here, though it is only the most extreme part of crime.
· The formation of rival dominating groups: any group that comes to dominate the others, be it a sect, the farmers, the aristocrats or a conglomerate; armed fighting between groups is only its extreme form. Read from how political power is spread by wealth, by social group and between town and country; how far groups are shut out of public services, state jobs and state business; how often groups outside the state use violence for political ends; the deaths in organized violence (fighting between armed groups, the state among them, and their attacks on civilians); and the share of income held by the richest tenth.
· A collapse of trust: a society splitting into hostile camps that no longer deal with one another. Read from how far it is divided into such camps, how sharply opinions clash on the major issues, and how often the major parties use hate speech.
· More and more people unable to meet their NEPs: read from the share of people without enough food, without basic drinking water and without basic sanitation, and from 2015 the share in severe food insecurity.
· The Participation to Burden ratio, which falls towards zero as the limit nears: here in its broader form, all the hours a society works against all the hours of work contained in what it uses, as this form can be worked out for every year from 2010 to 2020.
Each sign is read as its change since the first year it can be measured, so the index starts at 0: above 0, the society shows more warning than in that year; below 0, less. A sharp rise is a yearly rise larger than 95 of every 100 yearly changes seen among the world's countries.
How we measured it
The measures. Every measure is a yearly figure published for most countries of the world, so that each society can be set against the others:
· Rising crime: intentional homicides per 100,000 people (United Nations Office on Drugs and Crime, through the World Bank), 2010 to 2023.
· The formation of rival dominating groups: the V-Dem Institute's yearly ratings (version 16, 2026) of power distributed by socio-economic position, by social group and by urban–rural location, its indices of exclusion by socio-economic group, by social group and by urban–rural location, and its rating of political violence by non-state actors; the deaths in organized violence per 100,000 people (Uppsala Conflict Data Program, version 26.1); and the income share held by the richest 10% (World Bank, Poverty and Inequality Platform, from household surveys, in the years they were held).
· A collapse of trust: V-Dem's ratings of political polarization, polarization of society and political parties' hate speech.
· More and more people unable to meet their NEPs: the share of people undernourished and, from 2015, in severe food insecurity (Food and Agriculture Organization of the United Nations), and without basic drinking water or basic sanitation (WHO/UNICEF Joint Monitoring Programme), all through the World Bank.
· The Participation to Burden ratio in its broader form: the jobs in each country by the country whose final demand they serve (OECD, Trade in Employment, 2023 edition), with the weekly hours worked in each country (International Labour Organization; for China its national figures, and 47.0 hours in 2020, as in Part 1), 2010 to 2020.
V-Dem's ratings come from country experts, several for each country, whose answers are joined by a statistical measurement model; the other measures are counts and surveys. Power between town and country is read as its distance from "roughly equal" in either direction, as domination by either side is a dominating group.
One scale. The measures come in different units: killings per 100,000, shares of people, expert ratings, hours. Each is therefore read as its change since the society's first measured year, divided by how far the countries of the world usually lay from their average in that measure in 2010 (their standard deviation; for severe food insecurity, 2015). A value of 1 is a change as large as that usual distance of a country from the world’s average. Within a sign, its measures are averaged; the index is the average of the signs, with the ratio counted the other way round, as a fall in the ratio is a rise in warning.
Measured years only. No value is carried from one year into another. The index is built step by step from one measured year to the next, and each step uses only the measures measured in both of its years; a sign counts when at least one of its measures is. So a household survey or a later series adds to the index only where it exists. For Nigeria, which the employment tables do not cover, the index has the four signs without the ratio, as in Part 1.
How the signs are weighed. No weights were given, so the index printed here weighs the five signs equally. To see whether a result depends on that choice, the calculation was repeated with 20,000 random weightings of the signs, as in Part 5; a result counts as strong when it holds in at least 95 of every 100.
A sharp rise. The same index was worked out for every country of the world where each sign is measured: 525 yearly changes in 57 economies from 2010 to 2020 with all five signs, and 1,405 yearly changes in 144 countries from 2010 to 2023 with the four signs. A rise counts as sharp when it is larger than 95 of every 100 of these changes: 0.076 a year with five signs and 0.110 with four, at equal weights (the line is worked out again for each weighting). A step across a gap of several years is read per year.
Checks. For 2020, the ratio equals the one Part 1 works with, for all six societies (Brazil: 1.1184). The V-Dem ratings read here equal the values Our World in Data publishes from V-Dem's data (political polarization in 2025: United States 2.30, Brazil 3.22, India 2.08).
What the seven societies show
The warning index of the seven, from the first year with every sign measured to the last, the signs weighed equally (each year is drawn in Chart 28):
| Society | Years | Index in the last year | Rose in … of every 100 weightings | Sharp rise: change a year (sharp in … of every 100 weightings) |
|---|---|---|---|---|
| Brazil | 2010–2020 | +0.40 | 84 | 2015–16: +0.15 (85) |
| United States | 2010–2020 | +0.27 | 97 | 2019–20: +0.11 (76) |
| Egypt | 2010–2017 | +0.14 | 96 | 2010–11: +0.25 (92) |
| India | 2015–2020 | +0.10 | 86 | none |
| Russia | 2010–2020 | −0.01 | 41 | none |
| China | 2010–2020 | −0.02 | 37 | none |
| Nigeria* | 2016–2023 | −0.24 | 23 | none |
* Nigeria: four signs, as the employment tables do not cover it; its line for a sharp rise is that of the four signs (0.110 a year).
The rise in the United States (97 of every 100 weightings) and in Egypt (96) is strong. In Brazil and India the index rose under most weightings (84 and 86), but not under 95. In Russia and China it did not rise under most weightings, and in Nigeria it fell under 77 of every 100.
Nigeria. Nigeria's index fell (−0.24 from 2016 to 2023) while more and more of its people were unable to meet their NEPs: in 2024, 22.2% of them were undernourished and 26.4% severely food insecure, the highest shares of the seven. The fall comes from the counted killings, which fell by half (from 32.4 to 15.7 per 100,000); the collapse of trust grew only a little (+0.16), and the rival dominating groups did not grow (−0.11). In Part 4, Nigeria has the second-highest respect value of the seven (1.03): its people give the most of their own, and its squeezing of societal burden (0.69) and its worth level read against the set point (0.72), both the lowest of the seven, hold the value down. In RESPECT IS NOT COSTLY, THE INGREDIENTS ARE UNIVERSAL, the respect level is the scale of these very signs:
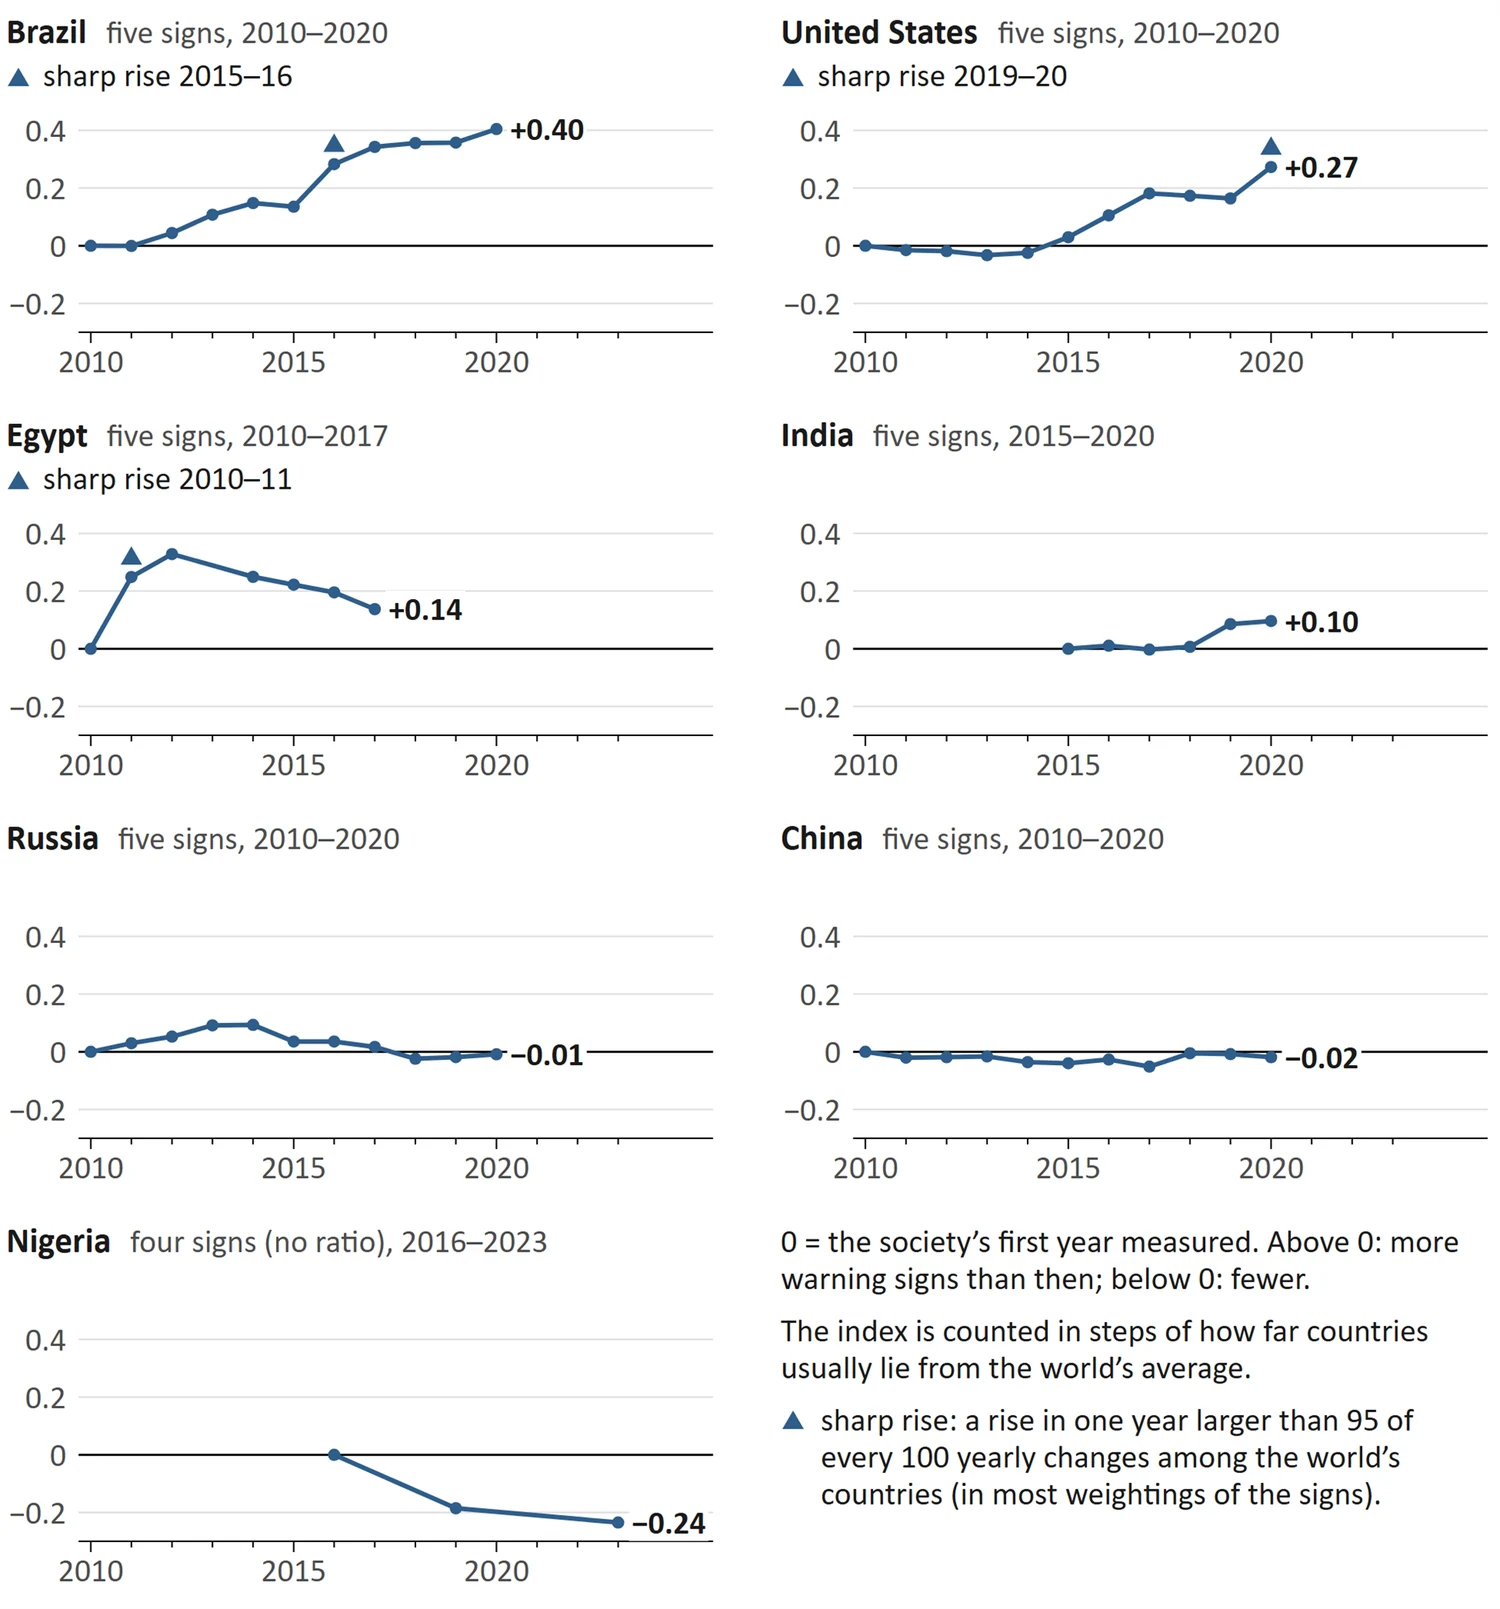
Chart 28: The warning index of the seven societies, year by year. The warning index of each society, year by year, from its first year with every sign measured, the signs weighed equally: the four warning signs and the Participation to Burden ratio (Nigeria: the four signs, as its ratio is not measured).
The Respect level scale tells us about the calmness of the society, the peace level, the integration level of the individuals, the progress level, the kindness level, the reliability of the society, the happiness level, the cooperation level, the trust level, etc.
and giving is the first step of the theory of the ultimate kindness cycle:
(The first step is always taken by the voluntary worthfuls, i.e. the Caretakers, as giving without waiting to receive is their very nature; the others join the chain as the resources reach them.)
Nigeria fits that picture: its people give the most of the seven, and its trust and its groups stayed calm while hunger rose. Yet the cycle needs "an overwhelming number of worthful individuals", and Nigeria's worth level, read against its set point, is the lowest of the seven. So Nigeria shows the first step of the kindness cycle, not yet the cycle itself: the giving is there, but not yet the worth that would keep the resources passing until no one goes short.
The signs behind these values, as their change over the whole period in steps of the world's spread (above 0, more warning):
| Society | Crime (counted killings) | Rival groups | Trust | NEPs unmet | Ratio |
|---|---|---|---|---|---|
| United States | +0.13 | +0.17 | +1.24 | −0.02 | −0.15 |
| China | −0.04 | −0.07 | 0.00 | −0.30 | +0.31 |
| Russia | −0.34 | −0.04 | +0.70 | −0.08 | −0.29 |
| Brazil | −0.41 | +0.52 | +2.31 | +0.02 | −0.42 |
| Egypt | −0.06 | −0.05 | +0.62 | +0.04 | +0.13 |
| India | −0.03 | +0.29 | +0.36 | −0.21 | +0.06 |
| Nigeria | −1.31 | −0.11 | +0.16 | +0.32 | – |
The collapse of trust grew in six of the seven, most of all in Brazil and the United States; in China it stayed level. The counted killings fell everywhere but in the United States, most of all in Nigeria; as most crime goes unreported, this shows its most extreme part, not all of it. More people went short of their NEPs in Nigeria, and slightly more in Egypt and Brazil, while in China and India fewer did. The ratio moved towards the limit in China, Egypt and India, and away from it in Brazil, Russia and the United States.
The four signs alone can be followed further, to the last year each is measured:
| Society | Years | Index in the last year | Rose in … of every 100 weightings | Sharp rise: change a year (sharp in … of every 100 weightings) |
|---|---|---|---|---|
| India | 2010–2022 | +0.35 | 82 | 2013–14: +0.19 (75) |
| United States | 2010–2023 | +0.32 | more than 99 | 2019–20: +0.13 (64) |
| Brazil | 2010–2023 | +0.21 | 74 | 2015–16: +0.19 (95) |
| Egypt | 2010–2017 | +0.14 | 89 | 2010–11: +0.29 (85) |
| Russia | 2010–2021 | +0.08 | 59 | none |
| China | 2010–2020 | −0.10 | 0 | none |
| Nigeria | 2016–2023 | −0.24 | 23 | none |
Here the rise in the United States holds under more than 99 of every 100 weightings, Brazil's rise from 2015 to 2016 is sharp under 95, and China's index fell under every weighting.
From different angles. Each result was checked in three more ways. Measure by measure, all three measures of trust rose together in the United States, Brazil, Russia and Egypt (in Brazil +2.21, +2.27 and +2.46). With any one measure left out, the index still rose under 94 to more than 99 of every 100 weightings in the United States, 84 to 99 in Egypt, 74 to 93 in Brazil and 75 to 98 in India; in Russia under 28 to 60, in China 0 to 49 and in Nigeria 7 to 35. Over the same years, the index from the counted measures alone (killings, deaths in organized violence, the richest tenth's share, hunger, water, sanitation, food insecurity and the ratio) and the index from V-Dem's expert ratings alone (power, exclusion, political violence, polarization and hate speech) agree for Egypt (rose under 97 and 85 of every 100 weightings) and for China (under only 24 and 18). They part for Russia (0 and 100), Brazil (2 and 100) and India (16 and 100), and for the United States (47 and 100) and Nigeria (16 and 57). So where the index rose in Brazil, India, Russia and the United States, the rise came from the two signs read from the experts' ratings, trust and rival groups; the counted measures there mostly improved.
The warning signs and the stealing of Pads
Further on, it is explained how a disturbed society keeps going. It reduces the agitation with Pads, and when its own are not enough, it takes them from others:
Likewise, a society with high HSP violation is so disturbed that it tries to satisfy its members with Pads, and as these Pads are not enough within itself, it steals them from other societies (mainly in the form of wealth).
It’s just like a mega-parasitic relationship with beneficiaries and sufferers at each level (this is true within the society and also among different societies).
Of the four warning signs, one follows this relationship across the world: more and more people unable to meet their NEPs. Among 59 economies, the societies that give more of their work to others than they draw from them are the ones whose people go short of food, drinking water and sanitation, while those that draw on the work of others have these met (rank agreement +0.71). The more a society's giving grew from 2010 to 2020, the more its share of people going short rose, or the less it fell (+0.42). Both links hold when only economies that command the same hours of human work per person, their own and other people's, in everything they use, are compared (+0.51 and +0.37). Inside a society, the same holds for the richest tenth: where they hold a larger share of the income, more people go short (+0.53 across 163 societies; +0.40 among the 57 whose hours are known, with the hours held the same). Chance alone would give links this close in fewer than 1 of every 100 random orderings.
The other signs do not follow it. Societies that draw on the work of others did not stay calmer by the warning index (+0.08). This is the picture that was drawn: the Pads explain "why the societies with high HSP violation are still making both ends meet", not why they would be calm, and what would follow without them is said in the same paragraph:
(if they are not allowed to have discriminatory policies, then they will ultimately suffer, and either they will abandon HSP violation or risk a total collapse)
Their unrest, which remains even while they draw on the work of others, points to the same: without the Pads they would collapse; with them, they hold together only to an extent. The counted killings fell more where societies give their work (−0.37). The measure of the drain itself comes next (see Pads drained between societies, below).