
The formula as written
The formula is set out in WHAT ABOUT THE GIFTS OF NATURE? as follows:
Let’s start with the societal boosting level. As described earlier, the natural resources are the boosters for societal effectiveness if considered in line with NEPs; the more NEPs are covered, the greater the boosting level, e.g. if one resource is useful in shelter, food, security, peace, and clothing, then it has a boosting level of 5, while the effectiveness within the domain is represented by a positive raised-to-power form, e.g. 5^+1, 5^+2, 5^+3, and so on.
Renewables ESR status = − (Gaining stress) (Consumption stress)
Recycled ones ESR status = − (Consumption stress)
Efficiency level = (Boosting level) + (ESR status)
Put together:
Efficiency level = (Number of NEP domains served)^(Effectiveness exponent) + ESR status
ESR status = −(Gaining stress) × (Consumption stress) for renewables; −(Consumption stress) for recycled ones
The efficiency level then decides, with the level of priority, whether a resource may be made indispensable:
Resources with a greater priority status and a high efficiency level are those that satisfy the green check to attain VIL (as a simple standard, a resource satisfies the green check when its efficiency level is positive, i.e. its boosting outweighs its environmental shock, and it stands high in the level of priority), while those with a lower priority status and a low efficiency level must be regarded as hazardous/incompatible for VIL status (as said earlier, in particular cases, ESR status is the determining factor for a thorough check-up for assigning the green check status, i.e. the eligibility criteria for VIL).
What it measures, in plain words
Every gift of nature does two things at once: it helps us meet the NEPs, and it leaves a mark on the environment. The boosting level counts the help (how many NEP domains the resource serves, raised to a power for how well it serves them). The ESR status counts the mark (the change the resource makes to the environment, multiplied, for a renewable, by the struggle nature goes through to put it back). A positive efficiency level means the help outweighs the shock; a negative one means the shock outweighs the help.
The formula scores each resource, not each society. The seven societies come in through the VIL: how much of the provision of their NEPs rests on resources that do not satisfy the green check.
The example of firewood and coal (its numbers are illustrative), step by step:
| Step | Firewood | Coal |
|---|---|---|
| NEP domains served | 2 (shelter, food) | 2 (shelter, food) |
| Effectiveness exponent | +1 | +2 |
| Boosting level | 2^+1 = 2 | 2^+2 = 4 |
| Gaining stress | 1 | 3 (replaced only over a longer period) |
| Consumption stress | 1 | 2 |
| ESR status | −(1)(1) = −1 | −(3)(2) = −6 |
| Efficiency level | 2 + (−1) = +1 | 4 + (−6) = −2 |
Hence, despite its greater boosting level, coal is far less efficient than firewood, which is why such a resource must not be promoted to VIL.
How we measured it
One unit and two fixed points
A natural resource is "any matter (that has mass & occupies space)", so every resource is compared per kilogram taken from nature, and "the same standard must be used for all resources". The standard is the example of firewood and coal: firewood stays at +1 and coal at −2. Each other resource is measured, its measure is divided by firewood's (or by its own group's standard), and the ratio is translated by a fixed conversion that turns the measured gap between firewood and coal into the gap of the example:
· Effectiveness. A kilogram of coal holds 25.8 megajoules of energy and a kilogram of firewood 15.6, so coal gives 1.65 times as much; the example gives +2 against +1. Conversion: exponent = (ratio)^1.378, since 1.65^1.378 = 2.
· Gaining stress. Firewood regrows in about 30 years (1 in the example); coal took about 100 million years to form (3). Conversion: gaining stress = (years to renew ÷ 30)^0.0731.
· Consumption stress. A kilogram of coal does 9.70 times the harm of a kilogram of firewood (measured as below); the example gives 2 against 1. Conversion: consumption stress = (harm ratio)^0.305.
A fixed power keeps every resource in its measured order; only the two points of the example set the size of the steps.
Each term of the formula
NEP domains. We count the domains the raw resource serves directly with at least 5% of its use. Electricity is not counted as a use of its own (in the example, firewood is useful in two of the NEP domains, shelter and food, and coal in the same two), nor are uses outside the NEPs (jewellery, investment bars, coins, central-bank reserves).
Effectiveness exponent. This is the performance of one kilogram in the main NEP use, against a standard with "the least effectiveness level": energy per kilogram against firewood (fuels); the property the main use needs against iron (metals: strength for aluminium, electrical conductivity for copper, silver and gold, rust resistance for nickel, stored energy for cadmium); person-days of need met per kilogram against water (food and water: water 0.0017, wild fish 1.9, salt 200). An exponent above 9, the top of the usual pair-by-pair comparison scale, is held at 9. Beside this main version, a check version keeps every exponent within +1 to +3, the range of the examples given with the formula (+2, +3).
Gaining stress. This is the number of years nature takes to renew the resource, and only renewables carry it. Renewables are what nature replaces "irrespective of the time required" (so coal, oil, gas and rock salt), while metals and uranium are recycled ones, which "are not replaced, as nature has provided a defined amount in raw form".
Consumption stress. The "change imparted by a natural resource during the consuming period on the normal status of the environment" means any change, so four were measured per kilogram: climate (greenhouse gas, in kilograms of carbon dioxide equivalent, CO2e), earth moved (rock and ore dug up), water drawn (fresh water taken) and persistent poison (mercury released; cadmium counted as the mercury that would do equal harm). Each is written as the share of the world's yearly total that a billion tonnes of the resource would make (climate 57.4 billion tonnes CO2e; earth moved about 150 billion tonnes; water 3,855 cubic kilometres; mercury 2,220 tonnes), and the four shares are averaged into a harm index: 0.288% for firewood and 2.790% for coal. Only the ratio to firewood's index matters.
The green check
The ESR status "is as important as the boosting level. In some cases, it is given more consideration, i.e. when the drastic effect is beyond the defined recovery line." So a resource satisfies the green check when all three hold:
· its efficiency level is positive;
· it stands high in the level of priority (short period before temperate before longer; reasonable period before artificially prolonged; high recycling capability before low);
· it is drawn within the recovery line, i.e. within nature's elastic limit.
The way, not the resource. These three are judged on a resource as it is obtained and used now. So a resource that does not satisfy the green check is not always lethal in itself; the reason it fails makes the difference:
· Where the harm comes with the resource's own use, the resource itself is lethal. Coal, oil and gas release their carbon when they are burnt: about nine-tenths of their climate harm (for oil, 3.17 of its 3.51 kg CO2e per kilogram) comes from burning them, not from getting them out; cadmium is a poison in itself. Used within a limit, only as much as the NEPs need, they are less lethal, but no change in the way of getting them makes them harmless.
· Where the harm comes from the way the resource is obtained, the resource itself is not lethal, and a change of strategy lowers the harm and can make it satisfy the check. Gold itself, once in use, changes almost nothing: all its harm (the earth moved, the water drawn and the mercury of its mines) comes from the way it is mined, and taking it back from used goods or mining it without mercury lowers that harm. Wild fish, as the world's fleets catch it on average now, does not satisfy the check; caught with less fuel, so that under about 1.1 kg CO2e is released per kilogram landed (2.17 now), from stocks within the recovery line, it does. Firewood, river water and groundwater satisfy it only while they are drawn within regrowth, renewal and recharge.
· Rock salt is not lethal at all: it fails only because nature takes millions of years to lay it down again, so it comes last in the level of priority, as coal, oil and gas do too; no change in the way can turn that.
How strong each verdict is
The four changes carry equal weights. Because a reader may weigh them differently and every input is uncertain, the calculation was repeated 20,000 times with random weightings and with every input moved within its range (measured values up to 1.5 times either way, or within the range their source states; the values not measured directly, up to 3 times). Five per-kilogram values rest on no direct measurement: the earth moved for river water, groundwater and sea salt, the water drawn for sea salt, and the earth moved for gold, which its source publishes as an estimate. Set at a tenth and at ten times their values, every verdict stays the same. The world's yearly earth moved (about 150 billion tonnes), which turns earth moved into a share, also rests on no direct measurement; set at a tenth and at ten times, every verdict stays the same. A verdict is strong when it holds in at least 95 of every 100 trials.
A worked example: aluminium
Aluminium is a reusable (a recycled one), so it has no gaining stress.
| Step | What is done | Result |
|---|---|---|
| 1. Domains | uses of 5% or more: transport (organizational tasks) 36%; packaging (food) 24%; building 13% and household goods 8% (shelter) | N = 3 |
| 2. Effectiveness ratio | strength per kg, both at their minimum yield strength: alloy 6061-T6, 241.3 MPa ÷ 2.70 g/cm³ = 89.4; structural steel S275, 275 ÷ 7.85 = 35.0 | 89.4 ÷ 35.0 = 2.55 |
| 3. Exponent | 2.55^1.378 (check version: held at 3) | 3.634 (check 3) |
| 4. Boosting level | 3^3.634 (check 3^3) | 54.2 (check 27) |
| 5. Changes per kg | 8.2 kg CO2e; 37.0 kg earth moved; 1,047.7 kg water drawn; 0.115 g mercury per tonne | |
| 6. Shares of world totals | 8.2 × 100 ÷ 57.4 = 14.29%; 37.0 × 100 ÷ 150 = 24.67%; 1,047.7 × 100 ÷ 3,855 = 27.18%; 0.115 × 100,000 ÷ 2,220 = 5.18% | |
| 7. Harm index | (14.29 + 24.67 + 27.18 + 5.18) ÷ 4 | 17.83% |
| 8. Consumption stress | (17.83 ÷ 0.288)^0.305 = 61.9^0.305 | 3.52 |
| 9. ESR status | recycled one: −(consumption stress) | −3.52 |
| 10. Efficiency level | 54.2 − 3.52 (check: 27 − 3.52) | +50.7 (check +23.5) |
| 11. Green check | positive; high priority (more than half is recycled at end of life); no limit crossed | satisfies it; positive in 99% of trials (check 99%): strong |
One more step for a renewable: wild fish. Wild fish serves one domain (food), so its boosting level is 1 whatever its effectiveness, since 1 raised to any power is 1. Fish stocks renew in about 2 years, so its gaining stress is (2 ÷ 30)^0.0731 = 0.82. For each kilogram landed, the world's fishing fleet releases 2.17 kg CO2e and, through its fuel, moves about 0.55 kg of earth and draws about 3.9 kg of water, with almost no mercury: shares 3.78%, 0.37%, 0.10% and 0.04%, a harm index of 1.07%, and a consumption stress of (1.07 ÷ 0.288)^0.305 = 1.49. Its ESR status is −(0.82 × 1.49) = −1.22, and its efficiency level is 1 + (−1.22) = −0.22.
The results for all resources scored
All seventeen resources were scored in the same way; their inputs are listed in the worksheet below, and their efficiency levels are drawn in Chart 19.
| Resource | Efficiency level (main / check) | Positive in (share of trials) | Green check | Verdict |
|---|---|---|---|---|
| Firewood | +1 / +1 (example) | 100% | satisfies it, only within regrowth | strong |
| Coal | −2 / −2 (example) | 0% | does not satisfy it | strong |
| Oil | +309 / +59 | 100% / 99% | does not: low priority, beyond the recovery line | strong |
| Natural gas | +21 / +3.3 | 100% | does not: low priority, beyond the recovery line | strong |
| Uranium | −7.8 / −7.8 | 0% | does not satisfy it | strong |
| Iron | +0.02 / +0.02 | 50% | on the edge | not strong |
| Aluminium | +51 / +23 | 99% | satisfies it | strong |
| Copper | +506 / +2.2 | 99% / 80% | satisfies it (main); uncertain (check) | not strong |
| Nickel | +19,679 / +23 | 99% | satisfies it | strong |
| Silver | −31.3 / −31.3 | 0% | does not satisfy it | strong |
| Cadmium | −132 / −132 | 0% | does not satisfy it | strong |
| Gold | −138 / −138 | 0% | does not satisfy it | strong |
| Wild fish | −0.22 / −0.22 | 23% | does not as caught now (2.17 kg CO2e per kg landed); satisfies it when caught with under about 1.1 kg, from stocks within the recovery line | not strong |
| River water | +1.8 / +1.8 | 100% | satisfies it, only within renewal | strong |
| Groundwater | +1.5 / +1.5 | 100% | satisfies it, only where pumped within recharge | strong |
| Sea salt | +511 / +7.0 | 100% | satisfies it | strong |
| Rock salt | +508 / +3.7 | 100% / 99% | does not: low priority (longer period) | strong |
Sources: see the Sources list, Part 5.
Fourteen of the seventeen verdicts are strong: six resources satisfy the green check under any weighting (firewood, river water, groundwater, sea salt, aluminium, nickel) and eight do not (coal, oil, gas, uranium, gold, silver, cadmium, rock salt). Iron sits on the line; copper passes less surely when the power is kept within +3; wild fish, as the world's fleets catch it now, is negative in 77% of trials. Of the sea-fish stocks assessed in 2023, 37.6% were fished beyond what they can replace; by weight, however, 72.6% of the catch from assessed stocks came from stocks within the recovery line.
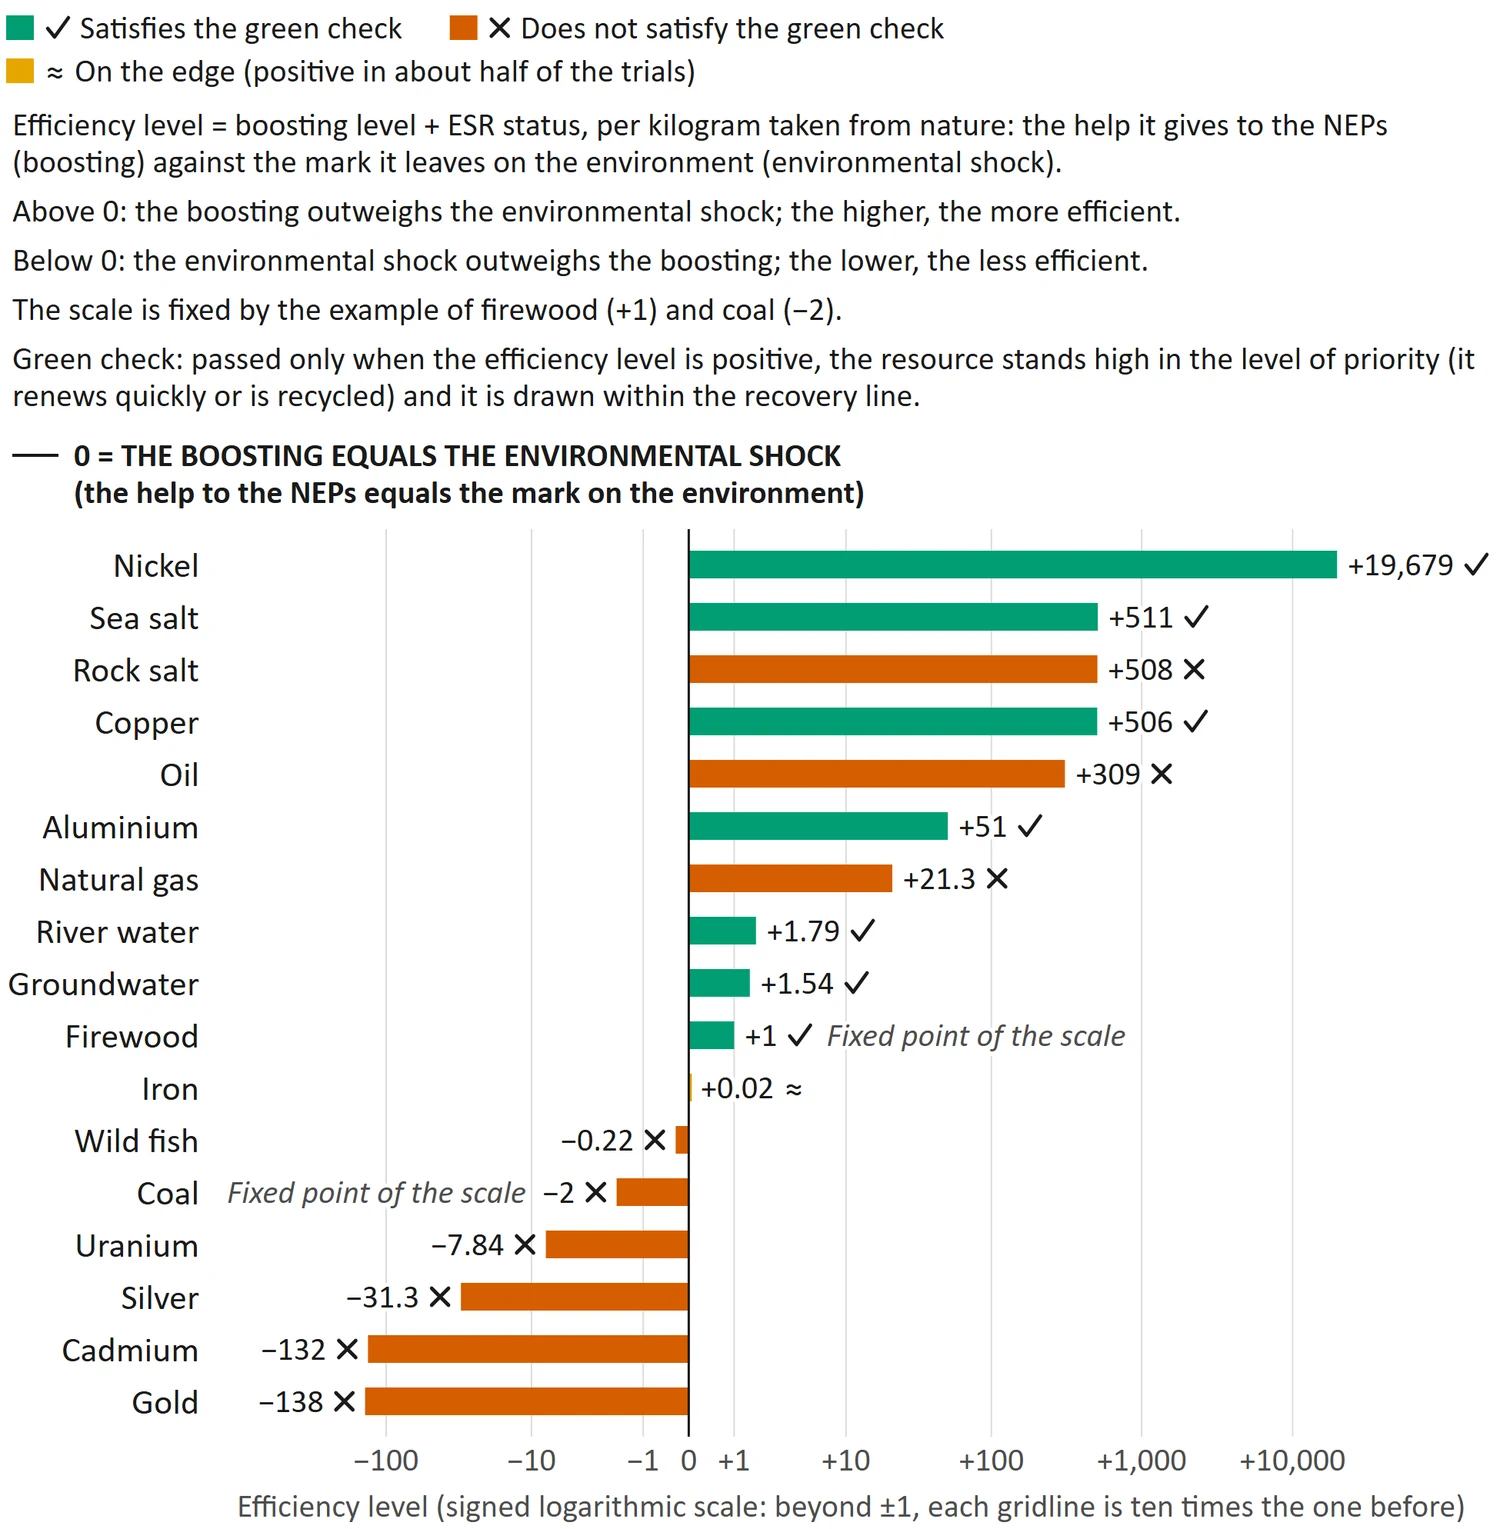
Chart 19: Efficiency level of each resource, per kilogram. Each bar is one resource's efficiency level on the scale set by firewood (+1) and coal (−2), drawn on a scale where each gridline is ten times the one before, with a mark showing whether the resource satisfies the green check.
Oil, gas and rock salt show why the check asks for more than a positive number. They serve several domains with much use per kilogram, yet nature replaces them only over millions of years, so they "come last in the level of priority", and the carbon of oil and gas has already passed the recovery line, where the ESR status is "the determining factor". Uranium serves no domain directly (its use is electricity), so its efficiency level is its ESR status alone. Gold, cadmium and silver do more harm than coal in all four changes: a kilogram of gold, sharing its mines by weight with the silver mined alongside it, moves about 258,000 kg of earth, draws about 121,000 kg of water and comes with about 0.27 kg of mercury, while only 7% of the gold used serves an NEP (electronics). Sea salt, given back by the sea each season, satisfies the check; rock salt, laid down over geological time, does not.
The VIL depth of the seven societies
VIL, and the way to check its depth, are explained as follows:
This level of incorporation of a resource in the society is known as the Virtual Inevitability Level (VIL). Once a resource is designated as VIL, it is a laborious struggle to retract it from this level. (The way out is gradual, i.e. a resource that satisfies the green check is first raised alongside it, and only then is the old one withdrawn step by step, so that the NEPs are never compromised in the meantime.) So, there is a standard to help us identify the resources that must be prevented from attaining it, and others that should be promoted to the status of VIL.
(In practice, how deeply a resource has reached VIL can be measured by how much of the NEPs depends on it, and by testing what would happen to the NEPs if it vanished; the deeper this dependence, the more urgent the gradual way out discussed above.)
How it was measured. If the resources that do not satisfy the green check vanished at once, what share of the present provision of four domains would stop?
· Food. Two parts of today's farming rest on those resources.
o The nitrogen that crops need is partly made in factories from natural gas (and some coal). The high bound is its share of all nitrogen put on the fields; the low bound is the part of the nitrogen carried off in crops that all other sources (manure, crops that fix their own nitrogen, rain, seed) could not supply even with nothing wasted. The middle is used, plus the share of protein that comes from wild-caught fish.
o The farm work is partly done by machines: engines on diesel and petrol, and electric motors on electricity from coal, oil, gas and uranium. Their work is the farm fuel times the part an engine turns into work (28.2–32.9% of the fuel's gross heat and 30.2–35.2% of its net heat, from a tractor test), plus that electricity times the part a motor turns into work (85%). The work of the people farming: a person can do hard work for only about 4 hours a day, giving 60 watts, about 240 watt-hours a day (200–300); so each hour they work counts at 60 watts, up to 4 hours a day (28 a week). The machine share is the machines' work divided by the machines' and the people's work together.
o Only food that needs neither the factory nitrogen nor the machine work would go on as it is, so the share that would stop is 1 − (1 − the nitrogen and fish share) × (1 − the machine share).
· Cooking and heating (shelter). The share of people cooking with clean fuels (mainly gas and electricity); the rest use mostly firewood.
· Electricity. The share generated from coal, oil, gas and uranium.
· Transport (organizational tasks). Oil's share of liquid fuels (oil plus plant fuels).
The VIL depth is the average of the four. The what-if-it-vanished test takes the production adequacy of Part 3 (the average of six need-parts: food, health workers, water, sanitation, electricity, teachers), cuts the food part by the nitrogen and fish share and the electricity part by its share, and averages again. As the set point is the NEP hours given divided by the production adequacy (Part 3), the hours needed rise in the same proportion. The farm work that machines do now would then have to be done by hand, as hard work at 60 watts, and those hours, per capable adult a week, are added to the hours needed. The hours given, the worth level, stay as they are at first.
| Society | Food: factory nitrogen and wild fish | Food: farm work by machines | Food, both together | Cooking and heating | Electricity | Transport |
|---|---|---|---|---|---|---|
| Egypt | 86% | 95% | 99% | 100% | 87% | 100% |
| Russia | 46% | 99% | 99% | 100% | 83% | 100% |
| United States | 41% | 100% | 100% | 100% | 74% | 95% |
| India | 36% | 91% | 94% | 81% | 76% | 99% |
| China | 50% | 93% | 96% | 90% | 63% | 100% |
| Brazil | 16% | 98% | 98% | 98% | 13% | 82% |
| Nigeria | 21% | 3% | 24% | 28% | 69% | 100% |
| Society | VIL depth (range) | Production adequacy now → if they vanished (with pumping) | Set point, hours needed a week per capable adult: now → if they vanished (food and electricity cut + farm machine work by hand = together, range) (with pumping) | Worth level, hours given a week |
|---|---|---|---|---|
| Egypt | 97% (96–97%) | 0.90 → 0.63 (0.48) | 36.4 → 52.4 + 41.5 = 93.9 (84.7–103.4) (109.1) | 32.5 |
| Russia | 96% (95–96%) | 0.98 → 0.77 (0.64) | 31.8 → 40.7 + 104.7 = 145.4 (121.5–170.8) (153.7) | 30.9 |
| United States | 92% (92–92%) | 1.00 → 0.81 (0.68) | 33.0 → 40.8 + 134.3 = 175.1 (144.3–207.8) (182.5) | 32.6 |
| India | 87% (86–88%) | 0.89 → 0.70 (0.59) | 40.8 → 51.7 + 66.9 = 118.6 (104.3–133.3) (128.5) | 36.1 |
| China | 87% (86–88%) | 0.99 → 0.80 (0.70) | 32.9 → 40.5 + 59.9 = 100.4 (86.9–114.8) (106.3) | 32.2 |
| Brazil | 73% (73–73%) | 1.04 → 0.98 (0.96) | 25.0 → 26.4 + 71.3 = 97.7 (79.6–117.8) (98.3) | 25.6 |
| Nigeria | 55% (54–56%) | 0.73 → 0.62 (0.55) | 45.1 → 52.8 + 0.2 = 53.0 (53.0–53.1) (60.2) | 32.5 |
Sources: see the Sources list, Part 5. The range comes from the low and high nitrogen bounds and, for the machines, from the engine (28.2–32.9%, or 30.2–35.2% on net heat) and the hard work a person gives (50–75 watts, from 200–300 watt-hours a day); "with pumping" also cuts the water and sanitation parts by half the electricity share.
A worked example: India.
| Step | Data | Result |
|---|---|---|
| Food: nitrogen, high bound | factory nitrogen 18.41 million t ÷ all nitrogen put on fields 30.24 million t | 60.9% |
| Food: nitrogen, low bound | other sources 30.24 − 18.41 = 11.83 million t; nitrogen carried off in crops 13.01 million t; (13.01 − 11.83) ÷ 13.01 | 9.1% |
| Food: nitrogen, middle | (60.9 + 9.1) ÷ 2 | 35.0% |
| Food: wild fish | fish 3.6% of protein supply × 34.2% of it wild-caught | 1.2% |
| Food: nitrogen and fish | 35.0 + 1.2 | 36.2% |
| Food: machine work | farm diesel and petrol 528,896 TJ (the official share of diesel used in farming, 12.89%, × the country's diesel use in 2023, 4,103,153 TJ) × 30.6% + farm electricity 866,880 TJ × 80.2% from coal, oil, gas and uranium × 85% | 752,496 TJ |
| Food: people's work | 245.8 million farm workers × 28 hours a week of hard work (they work 36.88; at most 4 a day counts) × 52 weeks × 60 watts | 77,305 TJ |
| Food: machine share | 752,496 ÷ (752,496 + 77,305) | 90.7% |
| Food | 1 − (1 − 0.362) × (1 − 0.9068) | 94.1% |
| Cooking and heating | people cooking with clean fuels | 81% |
| Electricity | coal, oil, gas and uranium share of generation (2025) | 75.9% |
| Transport | oil ÷ (oil + plant fuels) (2024) | 98.6% |
| VIL depth | (94.1 + 81 + 75.9 + 98.6) ÷ 4 | 87.4% (range 86.3–88.2%) |
| Production adequacy now (Part 3) | food 1.01, health workers 0.55, water 0.96, sanitation 0.83, electricity 1.00, teachers 1.00; average | 0.89 |
| Production adequacy if they vanished | food 1.014 × (1 − 0.362) = 0.647; electricity 0.999 × (1 − 0.759) = 0.241; new average (0.647 + 0.549 + 0.957 + 0.834 + 0.241 + 1.000) ÷ 6 | 0.70 |
| Set point if they vanished | 36.42 NEP hours a week per capable adult (Part 3, step 1) ÷ 0.7045 | 51.7 hours a week |
| Machine work done by hand | 752,496 TJ ÷ 60 watts = 3,484 billion hours a year ÷ 1,001.7 million capable adults ÷ 52 weeks | 66.9 hours a week |
| Hours needed if they vanished | 51.7 + 66.9 | 118.6 hours a week (now 40.8; hours given 36.1) |
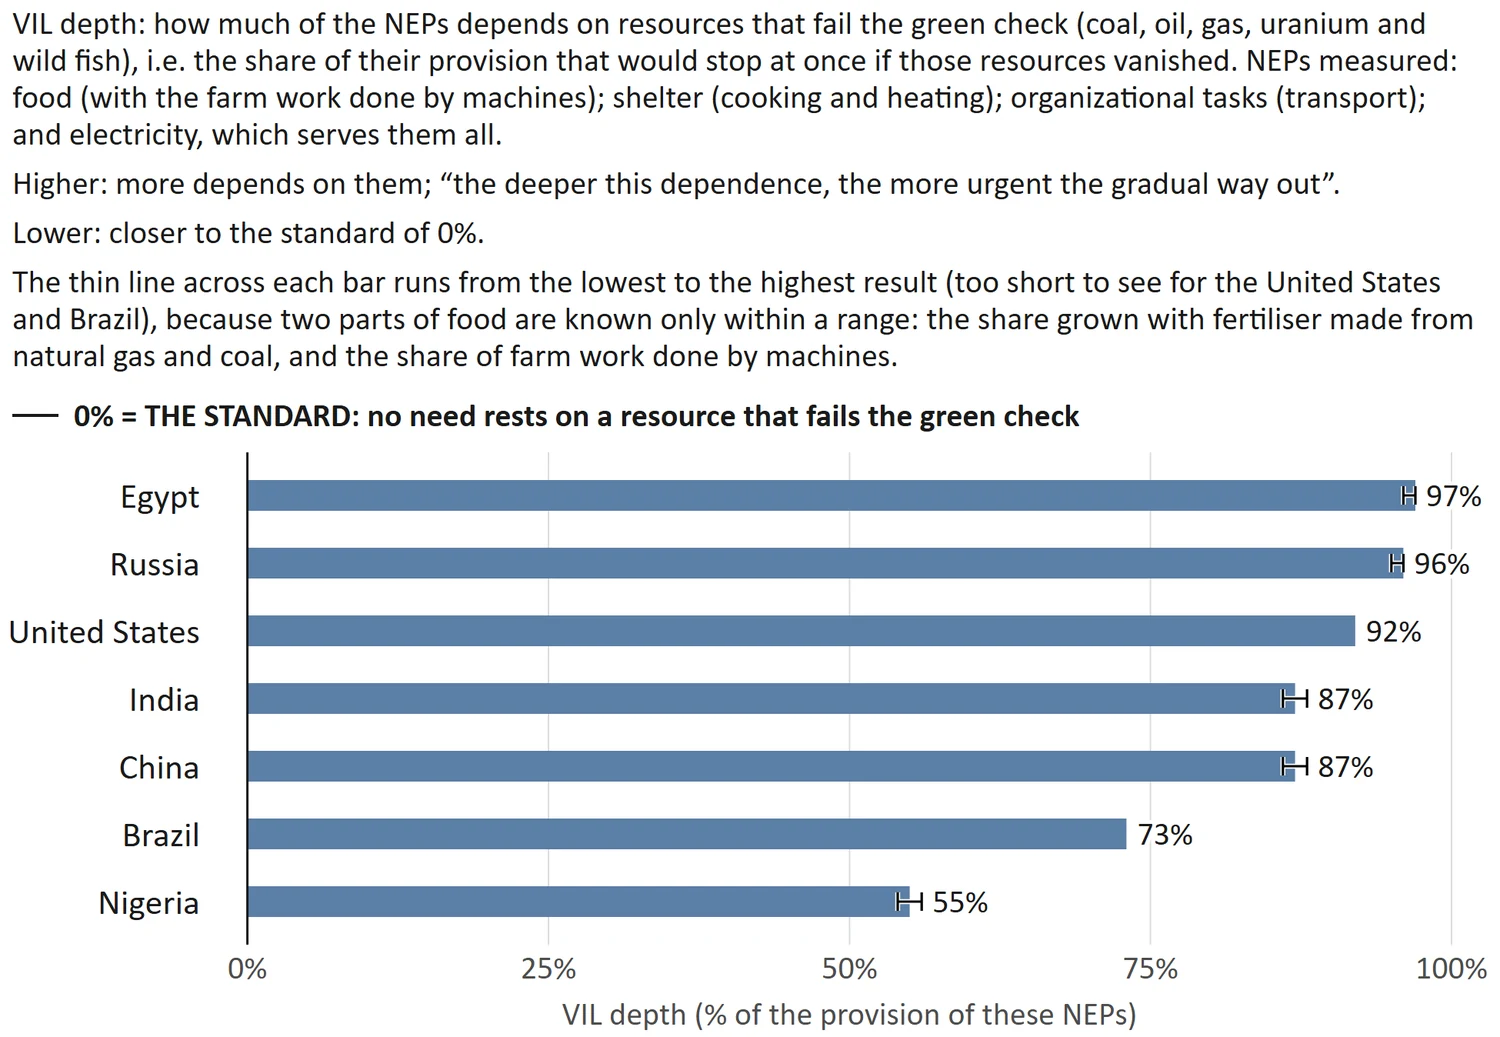
Chart 20: VIL depth: how much of the provision of the NEPs rests on resources that do not satisfy the green check. How much of the NEPs depends on resources that do not satisfy the green check: the share of the provision of food, shelter (cooking and heating), organizational tasks (transport) and electricity that would stop if those resources vanished at once, for each of the seven societies, with its range.
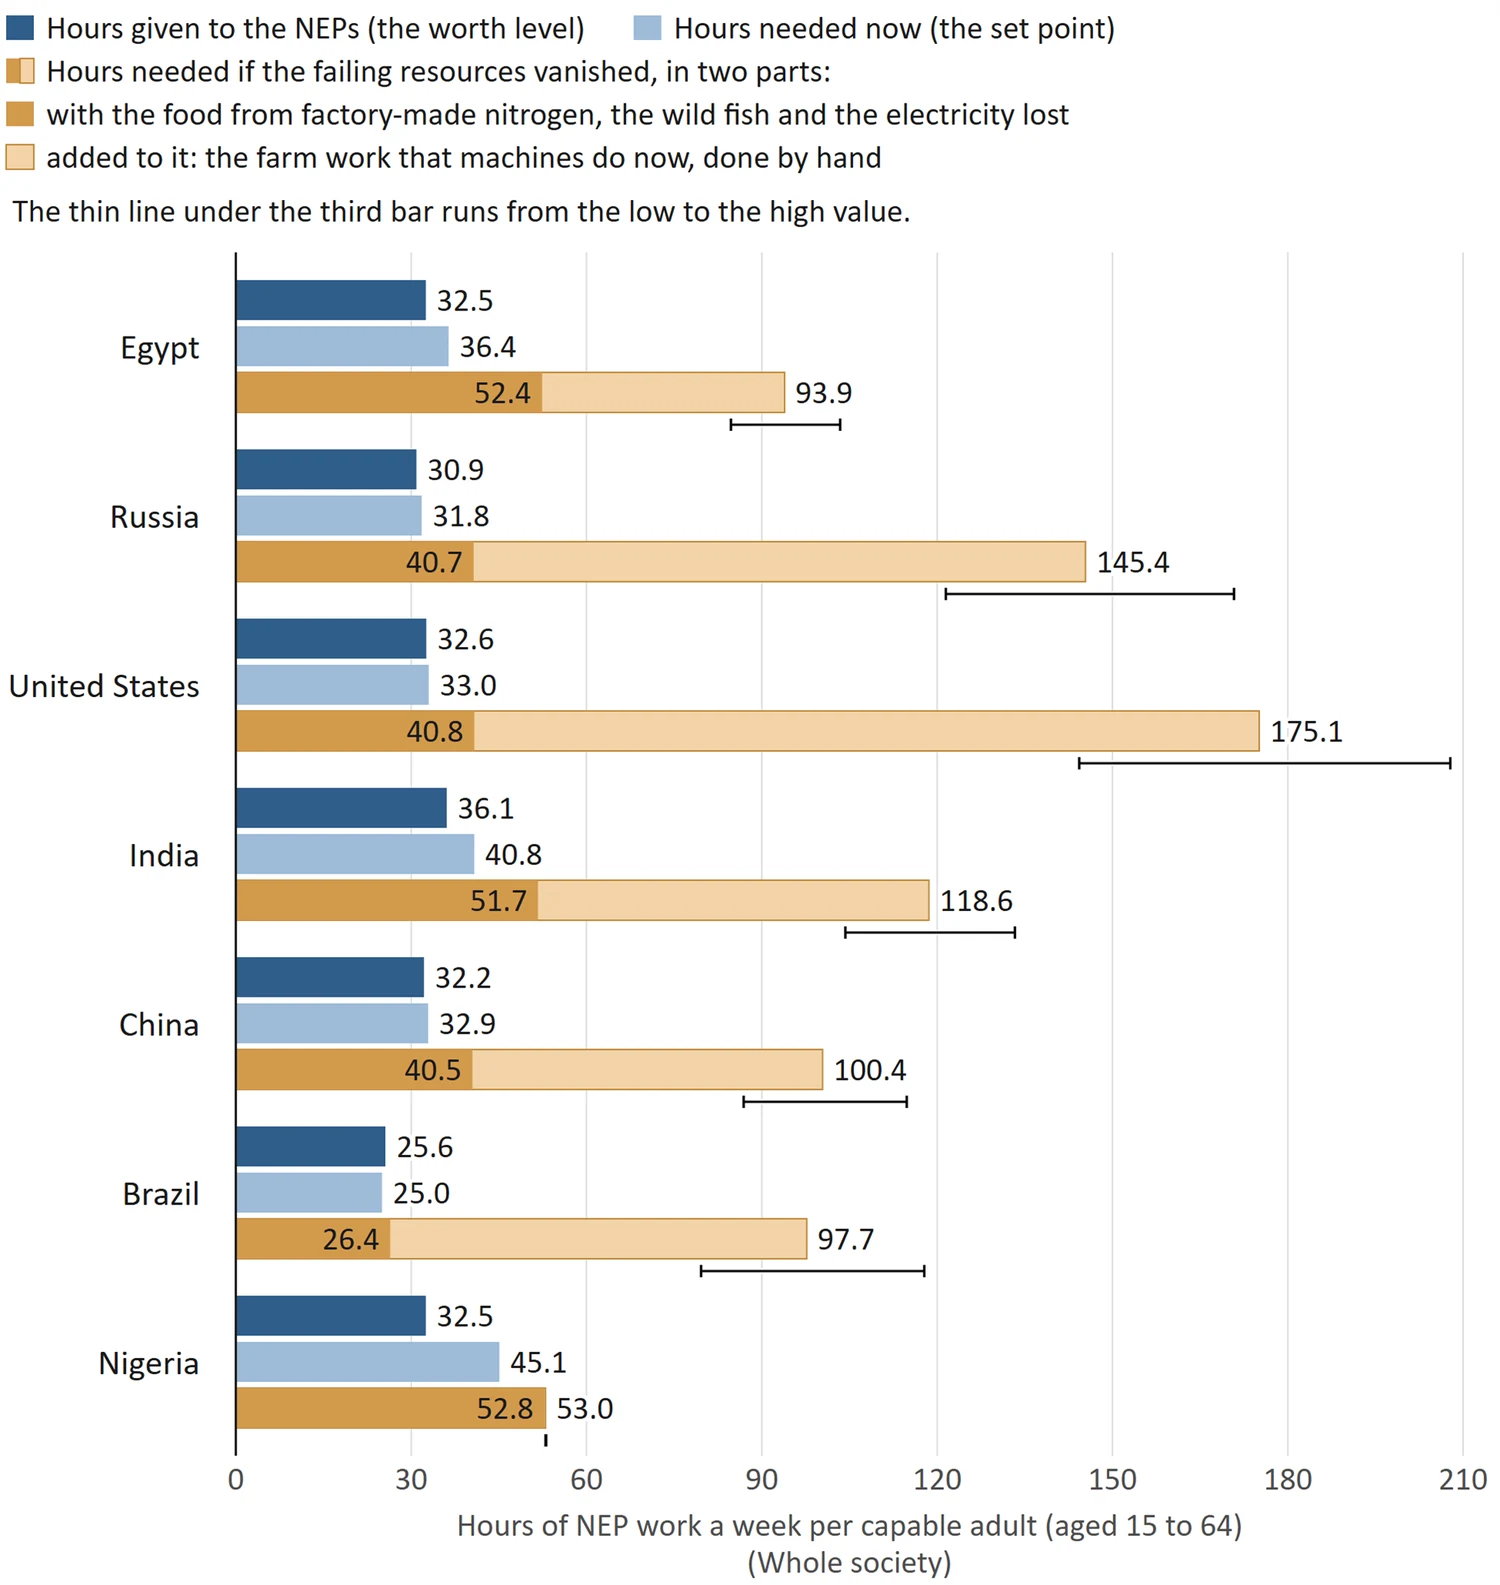
Chart 21: The set point now and if the failing resources vanished. The hours of NEP work needed a week per capable adult (the set point of Part 3) now and if the resources that do not satisfy the green check vanished at once, with the farm work that machines do now done by hand, beside the hours given now (the worth level). These resources do much of the physical work, so without them the same hours would produce less of the NEPs and the hours needed would rise: the darker part of the third bar is the rise with the food from factory-made nitrogen, the wild fish and the electricity lost; the paler part adds the hard work of doing by hand the farm work that machines do now, at 60 watts, which a person can keep up for about 4 hours a day. The thin line runs from the low to the high value in the table above.
What the results show. In all seven, between about half and nearly all of this provision (55% to 97%) rests on resources that do not satisfy the green check: the resources "on which daily life has come to depend so much that their abrupt loss would compromise the NEPs", in figures. Transport rests almost wholly on oil everywhere (82–100%). Once the farm machines are counted, food rests almost wholly on those failing resources too: 94–100% in six of the seven, as most of the farm work there (91–100%) is done by engines and motors on coal, oil, gas and uranium. For the world as a whole, 55% of cropland nitrogen is made in factories.
If the resources that do not satisfy the green check vanished at once, the hours needed would rise to between 1.6 and 5.4 times the hours given; the rise is greatest where machines do nearly all the farm work: in the United States, from 33.0 to 175.1 hours a week per capable adult, against 32.6 hours given. As a person can do hard work for only about 4 hours a day, 28 hours a week, the farm machines' work alone would need 134.3 hours of hard work a week from each capable adult there, 4.8 times what a person can give (Russia 3.7, India 2.4, Brazil 2.5, China 2.1, Egypt 1.5). In Nigeria, where the depth is lowest (55%), machines do about 3% of the farm work and 28% of people cook with clean fuels: the hours needed would rise only from 45.1 to 53.0 a week, but the low share shows a need met less, not a need met another way. In Brazil, most electricity comes from river water (13% from coal, oil, gas and uranium), much of the nitrogen from crops that fix their own, and part of the transport fuel from plants: resources that satisfy the green check are already raised alongside those that do not, as in the gradual way out. Its farm machines, however, still run mostly on oil, so its hours needed would rise from 25.0 to 97.7 a week.
Calculate it for any other resource or society
A. The efficiency level of any resource
Data needed (full details in the Sources list, Part 5):
· Uses: U.S. Geological Survey, Mineral Commodity Summaries, "Domestic Production and Use" (metals); an energy balance by sector (fuels); FAO AQUASTAT, withdrawals by sector (water).
· Effectiveness: IPCC 2006 Guidelines, Volume 2, Chapter 1, Table 1.2, net calorific values (fuels); reference values of density and electrical resistivity, and the minimum yield strength set in the material standards (metals); FAO/WHO/UNU protein needs and the WHO salt intake (food).
· Climate: IPCC 2006 Guidelines, Volume 2, Chapter 2, Table 2.5, with the IPCC AR6 100-year warming potentials (methane 29.8 fossil, 27.0 other; nitrous oxide 273) (fuels); Nuss and Eckelman 2014, Table S38, "GWP 100a" (metals).
· Earth moved and water drawn: Wuppertal Institute 2014 table, columns "abiotic material" and "water".
· Mercury: UNEP Global Mercury Assessment 2018, the matching sector's emissions ÷ world output of the resource.
· Years to renew: the scientific literature on that resource.
Steps:
· N = number of NEP domains served directly by uses of 5% or more (electricity not counted).
· Ratio r = performance per kg ÷ the standard's; exponent e = r^1.378 (at most 9; check version: between 1 and 3). Boosting level = N^e.
· Renewables only: gaining stress g = (years to renew ÷ 30)^0.0731.
· Shares: climate × 100 ÷ 57.4; earth moved × 100 ÷ 150; water drawn × 100 ÷ 3,855; mercury (grams per tonne) × 100,000 ÷ 2,220. Harm index H = their average; consumption stress c = (H ÷ 0.288)^0.305.
· ESR status = −(g × c) for a renewable, −c for a recycled one; efficiency level = boosting level + ESR status.
· Green check: positive? high in the level of priority? drawn within the recovery line?
| Item | Your resource |
|---|---|
| Domains N; ratio r; exponent e (main / check) | |
| Boosting level (main / check) | |
| Years to renew; gaining stress g | |
| Climate, earth, water, mercury per kg; their four shares | |
| Harm index H; consumption stress c | |
| ESR status; efficiency level (main / check) | |
| Priority; within the recovery line?; green check |
The inputs behind the results above (per kilogram; ★ = not measured directly; see How strong each verdict is):
| Resource | Domains N | Exponent (main / check) | Years to renew | Harm index H |
|---|---|---|---|---|
| Firewood | 2 | 1 / 1 | 30 | 0.288% |
| Coal | 2 | 2 / 2 | 100 million | 2.790% |
| Oil | 4 | 4.147 / 3 | 50 million | 1.871% |
| Natural gas | 2 | 4.704 / 3 | 50 million | 1.519% |
| Uranium | 0 | 9 / 3 | recycled one | 245.7% |
| Iron | 2 | 1 / 1 | recycled one | 2.712% |
| Aluminium | 3 | 3.634 / 3 | recycled one | 17.83% |
| Copper | 2 | 9 / 3 | recycled one | 90.47% |
| Nickel | 3 | 9 / 3 | recycled one | 30.04% |
| Silver | 1 | 8.042 / 3 | recycled one | 25,504% |
| Cadmium | 1 | 3.094 / 3 | recycled one | 2,659,041% |
| Gold | 1 | 2.194 / 2.194 | recycled one | 3,044,165% |
| Wild fish | 1 | 9 / 3 | 2 | 1.070% |
| River water | 2 | 1 / 1 | 0.046 (about 17 days) | 0.008% |
| Groundwater | 2 | 1 / 1 | 1,000 | 0.010% |
| Sea salt | 2 | 9 / 3 | 1 | 0.709% |
| Rock salt | 2 | 9 / 3 | 100 million | 0.923% |
| Resource | Climate (kg CO2e) | Earth moved (kg) | Water drawn (kg) | Mercury (g per tonne) |
|---|---|---|---|---|
| Firewood | 0.143 | 0.00037 | 0.0027 | 0.020 |
| Coal | 2.86 | 5.06 | 4.58 | 0.060 |
| Oil | 3.51 | 1.22 | 4.28 | 0.010 |
| Natural gas | 3.01 | 1.22 | 0.50 | 0.0002 |
| Uranium | 250 | 784 | 726 | 0.13 |
| Iron | 1.5 | 8.14 | 63.67 | 0.026 |
| Aluminium | 8.2 | 37.0 | 1,047.7 | 0.115 |
| Copper | 2.8 | 348.47 | 367.16 | 2.56 |
| Nickel | 6.5 | 141.29 | 233.34 | 0.19 |
| Silver | 827 | 35,707 | 16,888 | 1,695 |
| Cadmium | 3.2 | 22.18 | 343.69 | 236,100 (mercury-equivalent) |
| Gold | 5,983 | 258,468 ★ | 120,660 | 266,200 |
| Wild fish | 2.17 | 0.55 | 3.9 | 0.0008 |
| River water | 0.0001 | 0.01 ★ | 1 | about 0 |
| Groundwater | 0.0004 | 0.02 ★ | 1 | about 0 |
| Sea salt | 0.2 | 0.05 ★ | 0.01 ★ | 0.055 |
| Rock salt | 0.2 | 1.24 | 2.29 | 0.055 |
B. The VIL depth of any society
Data needed:
· FAO, FAOSTAT, Cropland Nutrient Balance (code ESB), element "Cropland nitrogen", items "Mineral fertilizers", "Input" and "Outputs" (tonnes).
· FAO, FAOSTAT, Food Balances (2010-) (code FBS), element "Protein supply quantity (t)", items "Grand Total" and "Fish, Seafood".
· FAO, FishStat, Global production by production source (tonnes live weight): capture and aquaculture of aquatic animals only (fish, crustaceans, molluscs and other aquatic animals; no aquatic plants).
· FAO, FAOSTAT, Energy use in agriculture (code GN), items "Petroleum products" and "Electricity" (terajoules, TJ).
· ILO, ILOSTAT: employment in agriculture, and the mean weekly hours actually worked in agriculture.
· World Bank / WHO, "Access to clean fuels and technologies for cooking (% of population)", code EG.CFT.ACCS.ZS.
· Ember, electricity generation (for example through the Our World in Data energy dataset): "fossil_share_elec", "nuclear_share_elec".
· U.S. Energy Information Administration (EIA), International Energy Statistics: consumption of "petroleum and other liquids" and of "biofuels".
· The six need-parts of the production adequacy, the NEP hours per capable adult (step 1) and the number of capable adults, from Part 3.
Steps:
· High bound = Mineral fertilizers ÷ Input. Low bound = (Outputs − (Input − Mineral fertilizers)) ÷ Outputs, not below 0. Nitrogen share = (high + low) ÷ 2.
· Wild fish = (Fish, Seafood ÷ Grand Total) × capture ÷ (capture + aquaculture), both for aquatic animals only. Nitrogen and fish = nitrogen share + wild fish.
· Machine work (TJ) = farm petroleum × 0.306 (× 0.327 where the fuel is counted on net heat, as in FAOSTAT) + farm electricity × its share from coal, oil, gas and uranium in the same year × 0.85. People's work (TJ) = farm workers × weekly hours (at most 28) × 52 × 60 watts × 3,600 ÷ 10^12. Machine share M = machine work ÷ (machine work + people's work). Food = 1 − (1 − nitrogen and fish) × (1 − M).
· Cooking and heating = EG.CFT.ACCS.ZS ÷ 100. Electricity = (fossil_share_elec + nuclear_share_elec) ÷ 100. Transport = (petroleum and other liquids − biofuels) ÷ petroleum and other liquids.
· VIL depth = (food + cooking and heating + electricity + transport) ÷ 4.
· What if they vanished: food part × (1 − nitrogen and fish); electricity part × (1 − electricity); average the six parts again. Hand hours = machine work × 10^12 ÷ (60 watts × 3,600) ÷ capable adults ÷ 52. Set point if they vanished = NEP hours per capable adult ÷ that average + hand hours.
| Item | Your society |
|---|---|
| Mineral fertilizers; Input; Outputs | |
| High bound; low bound; nitrogen share | |
| Fish share of protein; wild-caught share; nitrogen and fish | |
| Farm petroleum; farm electricity; machine work (TJ) | |
| Farm workers; weekly hours (at most 28); people's work (TJ) | |
| Machine share M; food | |
| Cooking and heating; electricity; transport | |
| VIL depth | |
| Six need-parts now; food and electricity parts after the cut | |
| Production adequacy now; if they vanished | |
| Hand hours a week | |
| Set point now; if they vanished (hours a week) |
Limits
· The four changes leave out uranium's long-lived radioactive waste; uranium does not satisfy the green check even without it.
· What counts as a domain, and which property measures effectiveness, are judgements made by one fixed method for all; the check version shows where the size of the power matters (copper).
· Gaining stress is measured here by time alone. Its second side is not measured: “if nature diverts more and more materials/correlated processes in the event, this means a high gaining stress”.
· Four results differ from the examples in WHAT ABOUT THE GIFTS OF NATURE?, and are stated here plainly:
o Salt as the food standard. Salt "can be a standard for the food domain but can be subject to debate". Measured by the need it meets per kilogram, salt is the most effective food resource (one kilogram meets about 200 person-days of the need), so water, the least effective, is used as the standard here, as "the standard must be selected carefully, with the least effectiveness level". With salt as the standard instead, no verdict changes; rock salt does not satisfy the green check either way.
o Nickel. The recycling capability of nickel is ranked low in the text, as little of it is recovered as pure nickel: about two-thirds of it goes into stainless steel, where it is only a small part of the alloy (8 to 10.5% in the common grade 304, 10 to 14% in grade 316), and it returns only inside steel scrap. Were nickel more than half of the alloy, the recycling of that steel could be taken as the recycling of nickel. Its use in the NEPs, however, is in that very form: the stainless steel of buildings, kitchens and food plants is recycled into new stainless steel, and more than half of the nickel at the end of its use is recycled this way (UNEP International Resource Panel, 2011). So in its NEP use nickel is recyclable, and this is why it is counted here as high in priority and satisfies the green check.
o Iron. Iron, the standard for the metals, sits on the edge (+0.02, positive in 50% of the trials), because a kilogram of iron moves more earth and draws more water than a kilogram of coal. If only the water it uses up is counted, not all the water drawn, it rises to +0.11 (positive in 70%).
o Firewood's smoke. Burned in open fires, as most firewood is today, a kilogram of firewood harms the air about four times as much as a kilogram of coal. Counted as a fifth change, coal would be only 1.4 times as harmful as firewood, and in 30% of the trials firewood would come out the more harmful, against the example of firewood and coal. This belongs to the stove, not to the wood, so the main result scores the resource and leaves the way it is burned aside.
· The VIL depth weights its four domains equally and takes the loss as sudden, before anything replaces it (an "abrupt loss"). Electric cooking counts as wholly dependent even where power comes partly from river water, and health workers and teachers are left uncut, so the falls in the production adequacy, and the rises in the hours needed, are, if anything, too small.
· Four NEP domains are not in the VIL depth: security, health care, teaching and clothing. How much of their energy and material comes from failing resources is not published for most of the seven societies, so they are left out rather than estimated.