
In this last Part the five values are brought together, so that the whole picture can be seen at once; then the links between them are examined, and a short roadmap shows how all five can be worked out for any other society.
The final values together
In Chart 22, the row under the heading gives the reference point for each column, so that every value can be read against it. The seven are listed in the order of the first column, highest first; Nigeria stands at the foot only because its ratio could not be measured from public data (see Part 1).
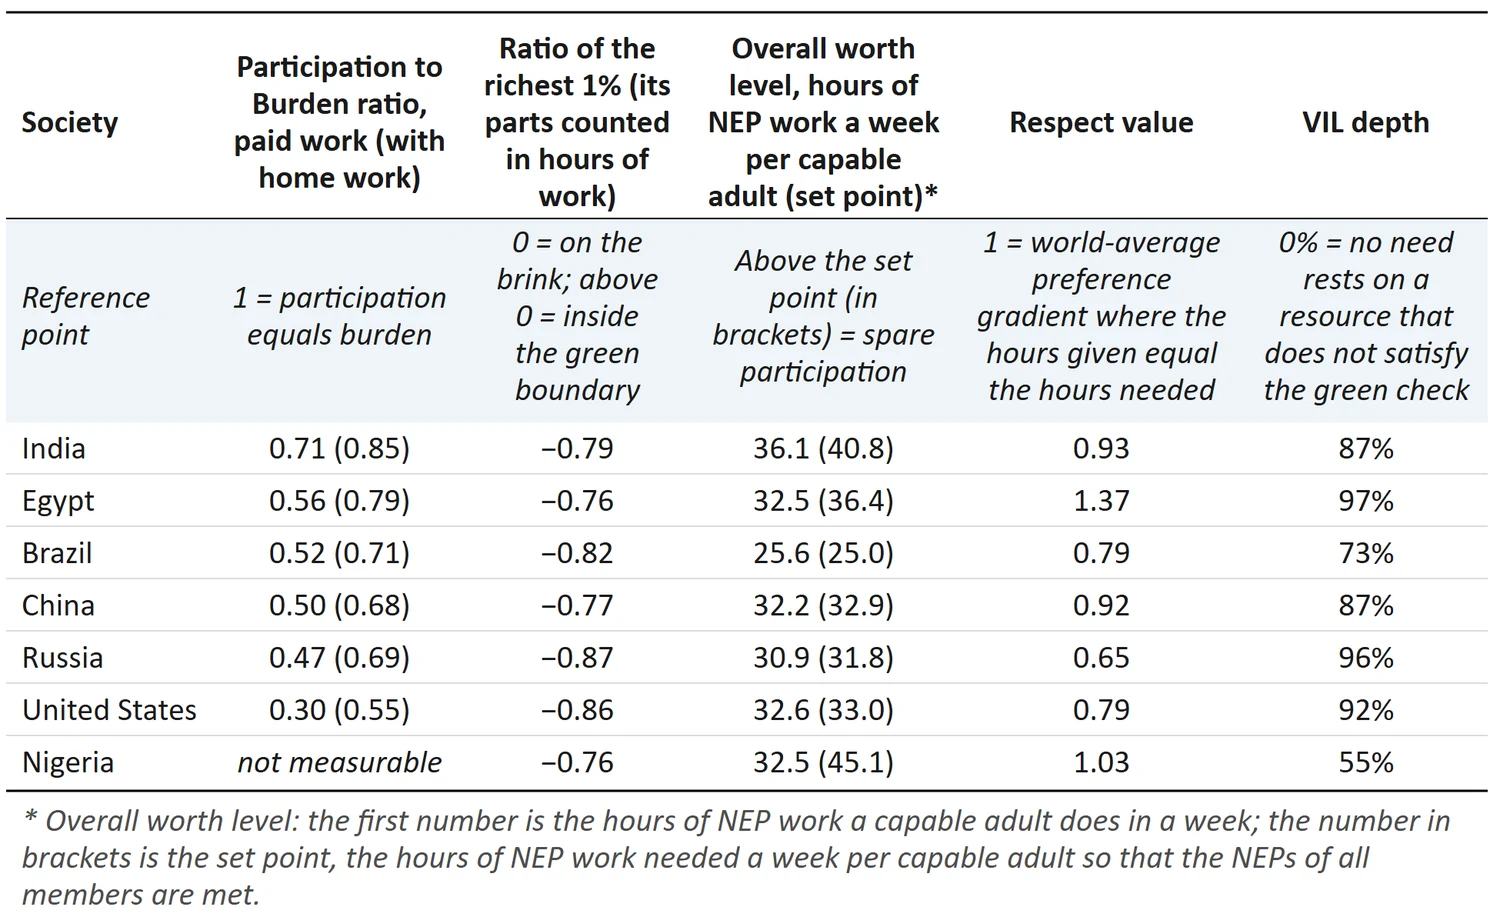
Chart 22: The seven societies side by side. The final value of each of the five formulas for each society, with the reference point for each column; the societies are ordered by the first column.
Sources: see the Sources list, Part 6.
In the first column, the value is the middle of the paid-work range of Part 1, and the value in brackets adds unpaid home work (cooking, cleaning, caring) on both sides. The VIL depth is the share of the provision of food, cooking and heating, electricity and transport that would stop at once if the resources that do not satisfy the green check (coal, oil, gas and uranium among them) vanished.
Read across the table, a few plain facts stand out:
· No society reaches 1 in the first column, even with home work counted (0.30 to 0.71; with home work 0.55 to 0.85). Only the top two and the last keep their places in every reading of Part 1.
· The ratio of the richest 1%, counted in hours of work, lies below zero in all seven, from −0.76 to −0.87: everywhere they draw about 12,500 to 24,900 hours of other people's work a year beyond their own, while working about 2,100 to 3,000 hours themselves.
· The overall worth level, the hours given to the NEPs per capable adult, is a little above the set point, the hours needed, only in Brazil (25.6 against 25.0 hours a week, from the food it sends to others), close to it in the United States, China and Russia (32.6 against 33.0, 32.2 against 32.9 and 30.9 against 31.8), and below it in the other three, furthest in Nigeria (32.5 against 45.1).
· The respect value runs from 0.65 to 1.37; the middle three (1.03, 0.93, 0.92) are not firmly ordered, nor are Brazil and the United States (both 0.79) (see Part 4).
· In every society, between about half and nearly all of the provision of the needs (55% to 97%) rests on resources that do not satisfy the green check.
[For what the worth level scale and the respect level scale tell us about a society, see What does the overall Respect level signify? under RESPECT IS NOT COSTLY, THE INGREDIENTS ARE UNIVERSAL.]
The five at a glance
The same values are drawn below as five small charts (Charts 23 to 27), one for each formula, each sorted by value, with that formula’s reference point drawn as a line.
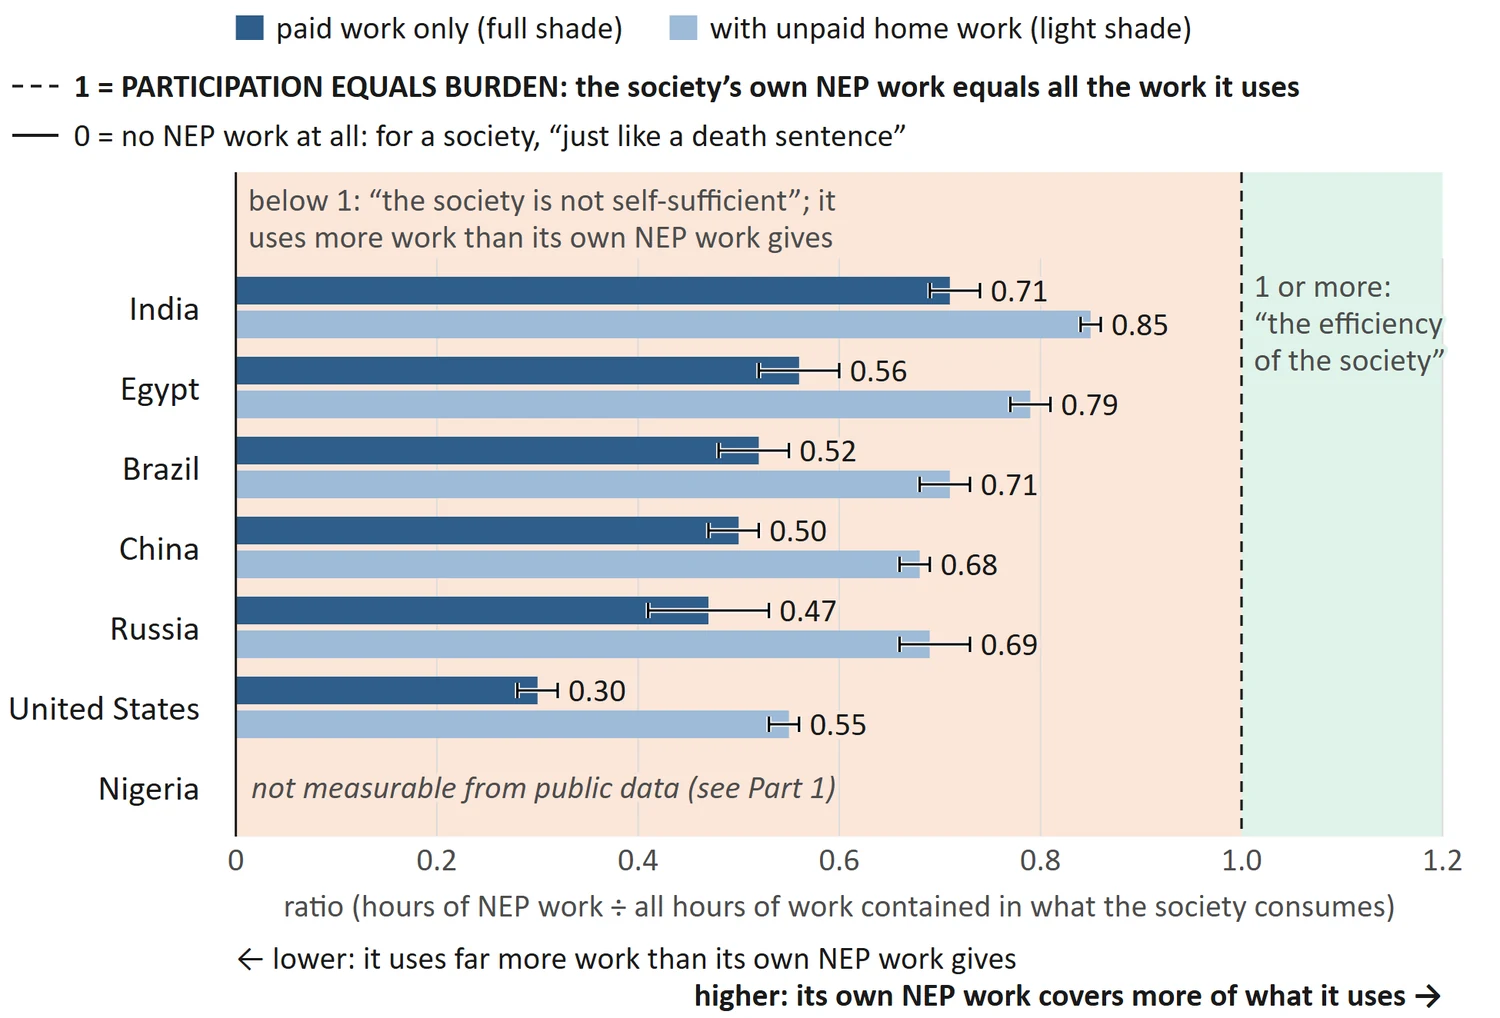
Chart 23: Participation to Burden ratio of a society. Hours of NEP work for every hour of work contained in what the society consumes, paid work only and with unpaid home work (cooking, cleaning, caring) counted on both sides; 1 means participation equals burden.
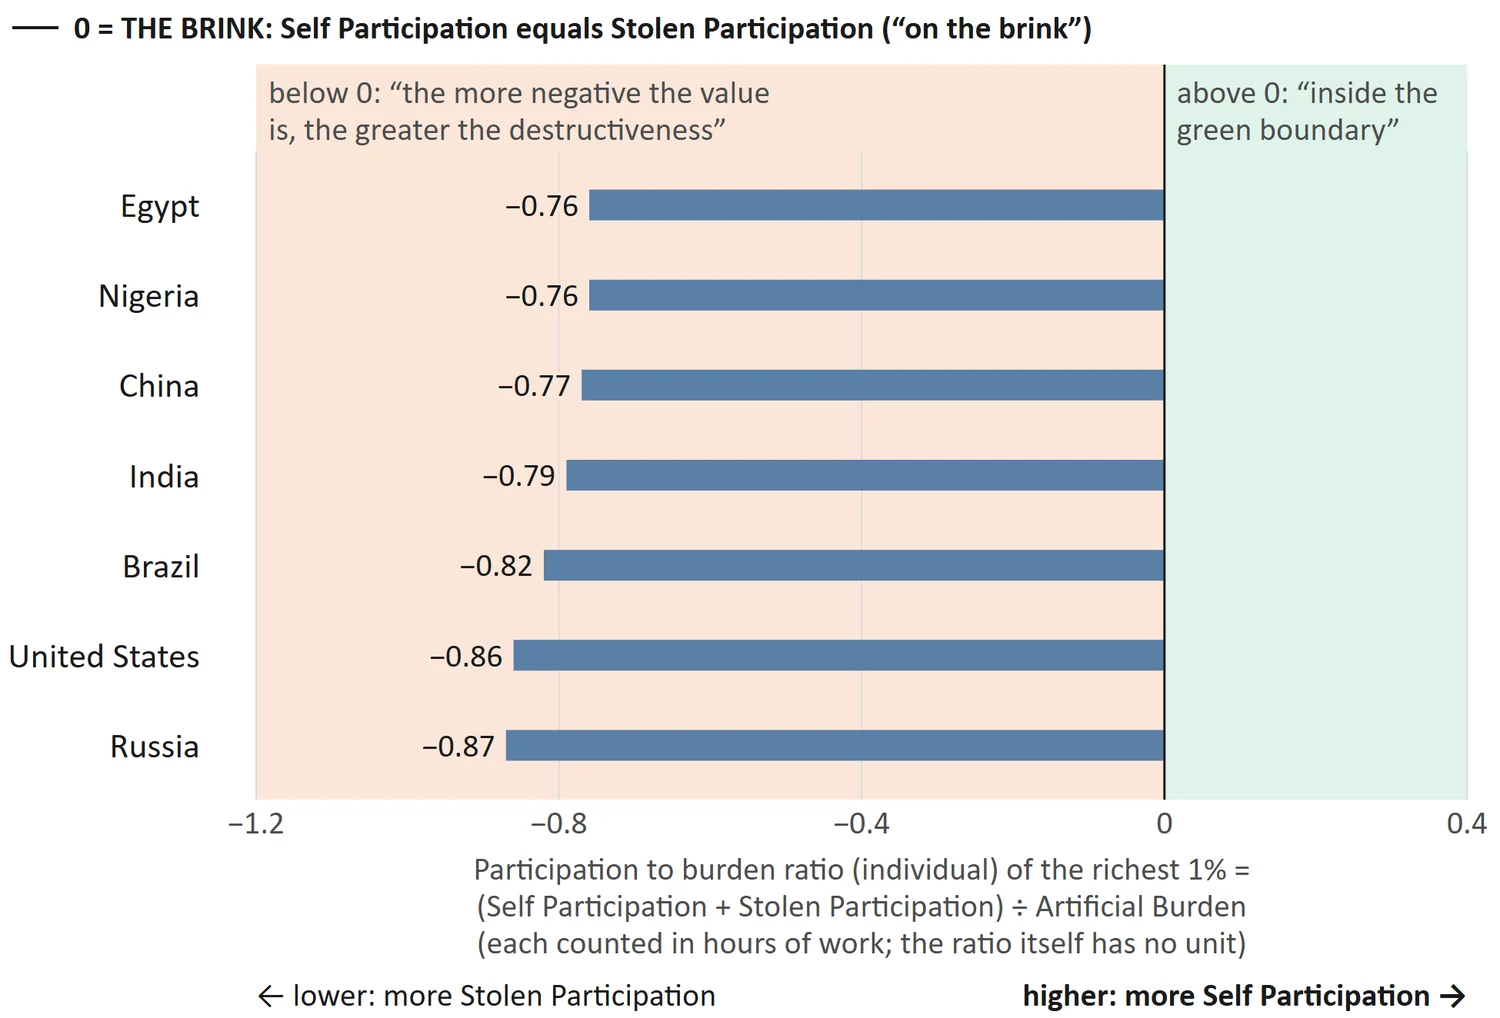
Chart 24: Ratio of the richest 1%. (Self Participation + Stolen Participation) ÷ Artificial Burden for the richest 1% of adults as one group; the line at zero is the brink, where their own work equals the work they draw from others. Each adult of the group draws from 12,529 (Nigeria) to 24,899 (Russia) hours of others’ work a year beyond their own (Part 2).
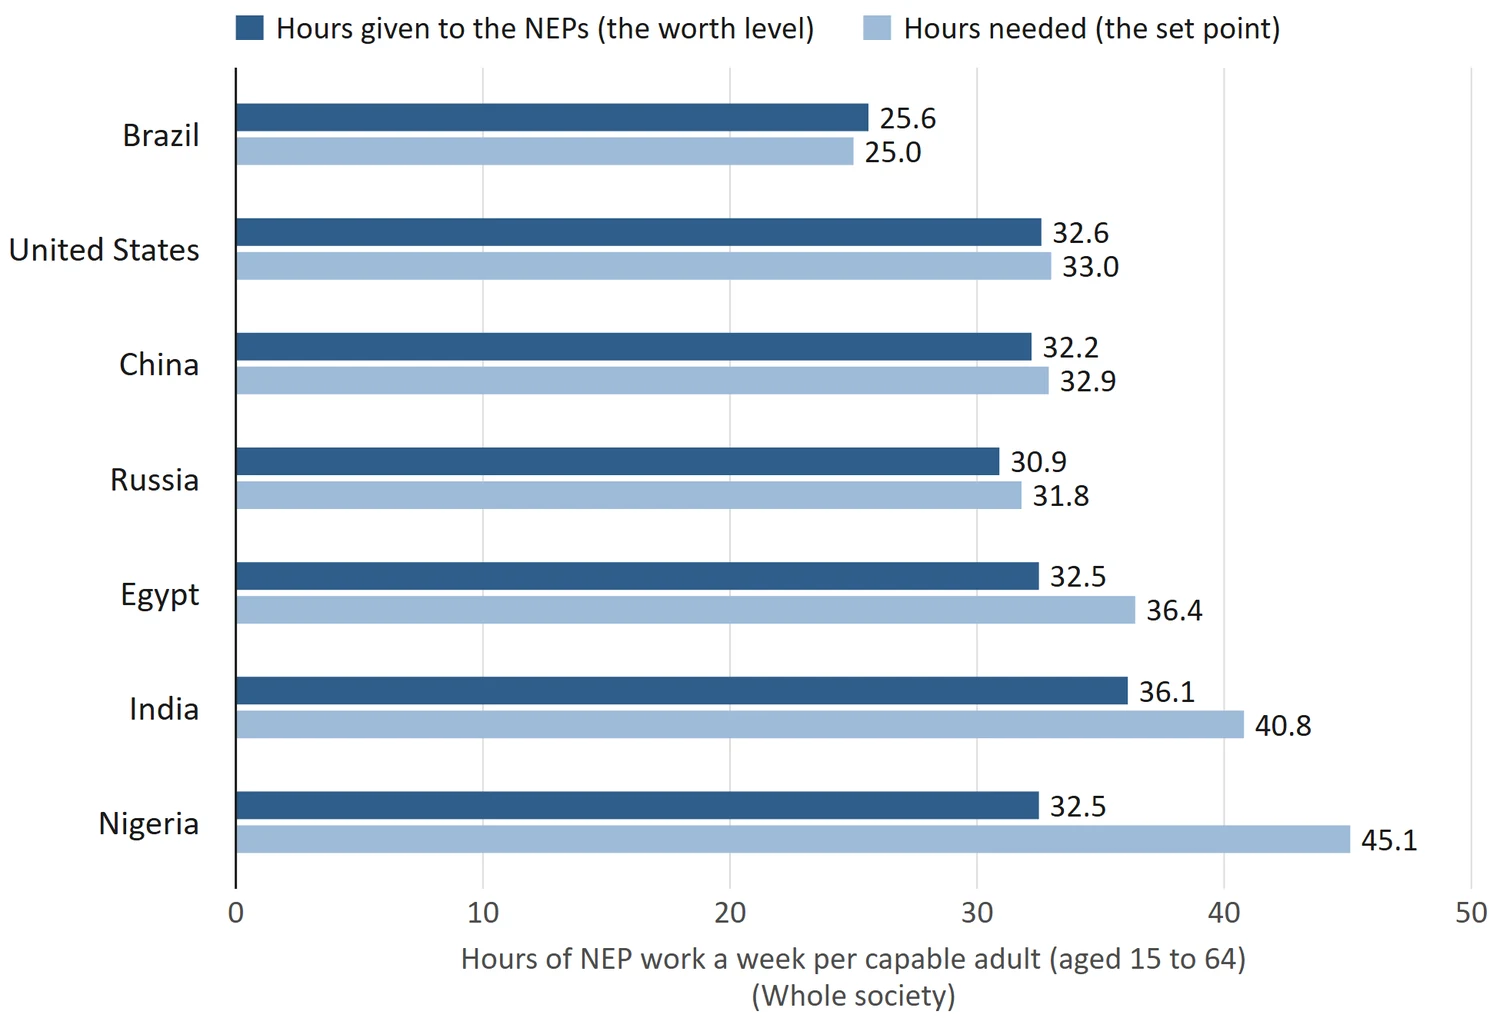
Chart 25: Overall worth level. The hours given to the NEPs a week per capable adult, with the set point, the hours needed, beside it. The first bar counts only the work of the society’s own capable adults; part of what a society uses is made by the work of other societies. In farming, food and clothing, three of the seven draw more of this work from other societies than they give (0.3 to 4.1 hours a week per capable adult, net), and three give more than they draw (0.9 to 1.3 hours); the exports of the seventh are not in the trade tables. Two of the three that give stand below their own set point: they send out part of their NEP work while their own NEPs remain unmet, i.e. they are being drained of their Pads (see the Shock and Pad Theory in THE DESTINED FUTURE (HSPs)). Food sent to others counts towards the needs only where a society gives more of this work than it draws (Part 3).
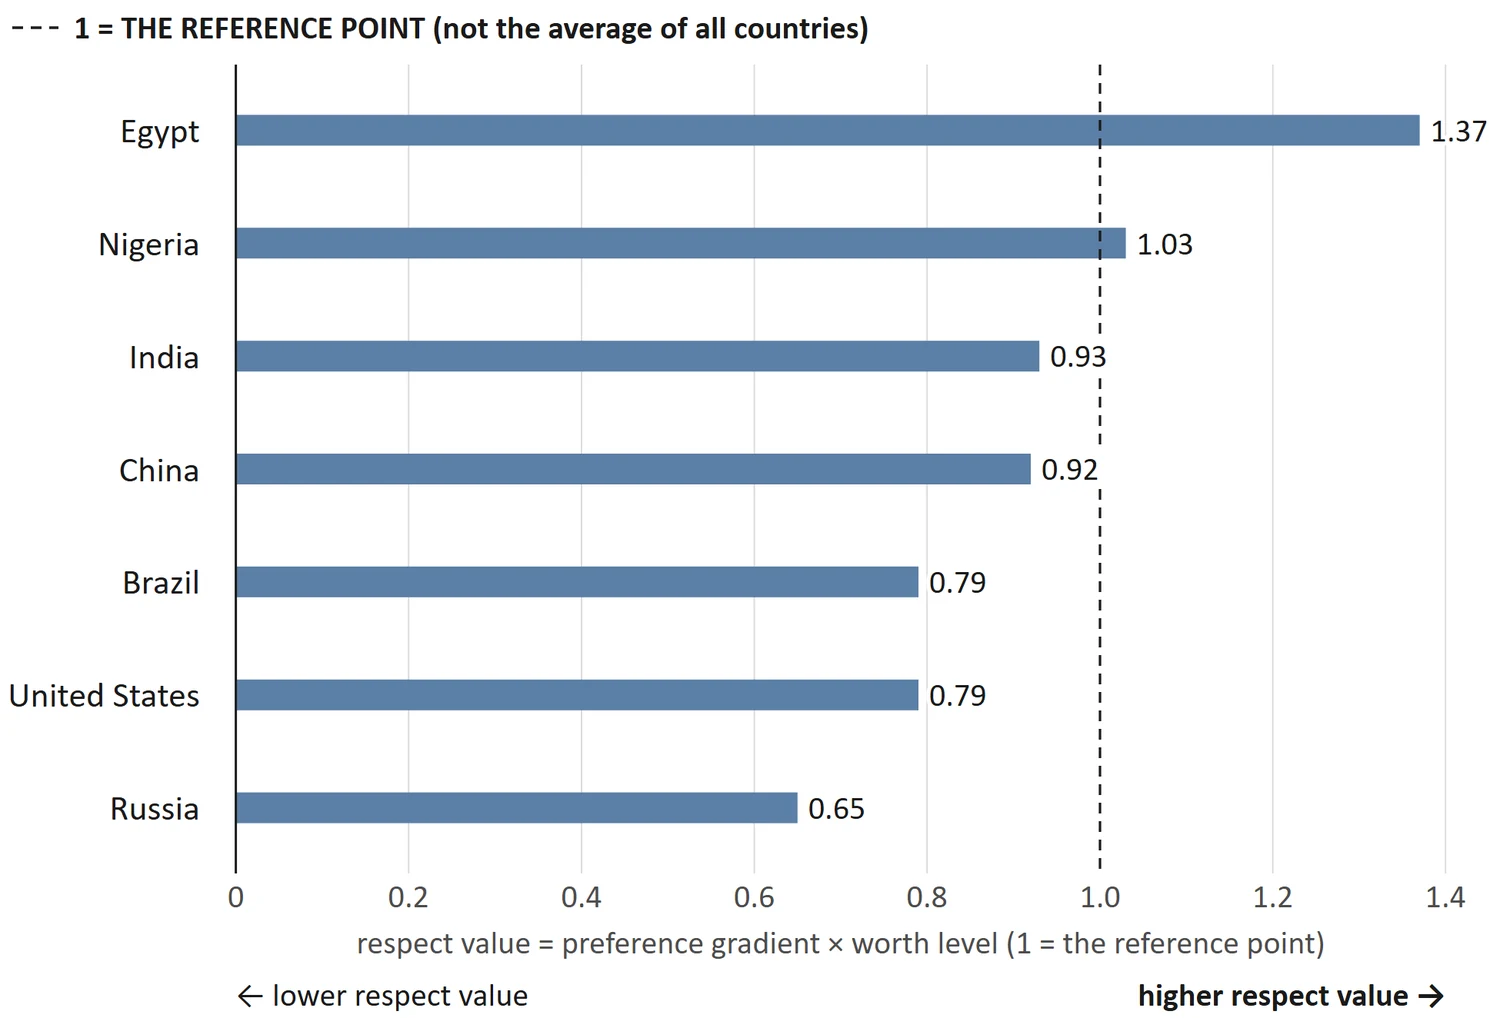
Chart 26: Respect value. Preference gradient × worth level (as a share of the set point); 1 is the reference point, a world-average preference gradient where the hours given to the NEPs equal the hours needed, not the average of all countries. The middle three values are too close to be told apart, and so are Brazil and the United States (both 0.79).
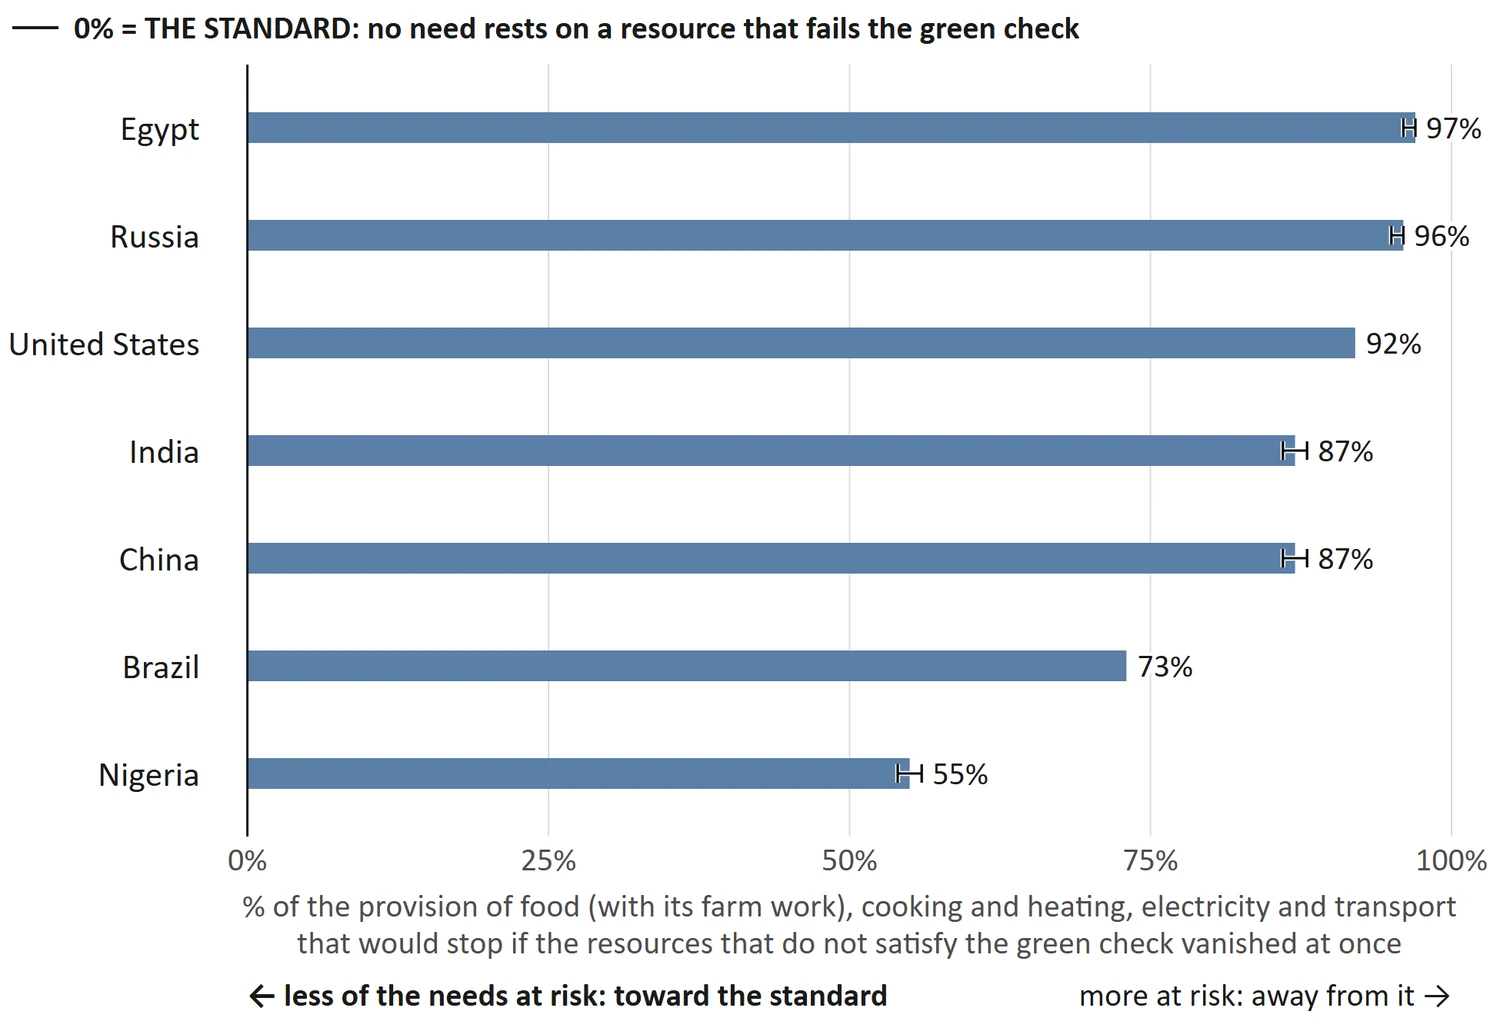
Chart 27: VIL depth. The share of the provision of the needs that rests on resources that do not satisfy the green check; the standard is 0%: no need should rest on a resource that does not satisfy the green check.
How the five values connect
The five formulas look at one society from five sides, so it is natural to ask whether their values move together. To find out, the seven were put in order by one value and then by another, and the two orders were compared. This is called a rank agreement: +1 when the two orders are the same, −1 when one is the exact reverse of the other, near 0 when there is no relation. With only seven societies it must reach about 0.8 either way (nearly 0.9 with six) before it can be taken seriously, and even then it shows a pattern, not a proof: it cannot tell which value causes which, or whether a third thing lies behind both. So wherever the data allowed, the pattern was tested again across many more economies.
Enough work for the needs, yet more is taken
The societies whose worth level stands highest against their set point (the hours given to the NEPs ÷ the hours needed) tend to have the lower Participation to Burden ratio (−0.60 among the six with both values, a tendency that six cannot confirm). The formulas do not quarrel here. Both rest on the same Natural Participation (the ratio is "the basis of the Worth level scale of the society"; see THE UNJUSTIFIED BURDEN AND ITS IMPLICATIONS), but the ratio also counts artificial burden, i.e. what is taken beyond the NEPs. So a society can give enough work for its needs and still not cover what it takes: the four that give about the hours needed or more have ratios of 0.30 to 0.52.
The ratio read with the resources
Below 1, the ratio is also read together with the society's resources:
The worst case is when the value is falling significantly below the minimum of 1, but the resources are still more than enough. This is basically the result of inter-societal dominance with the leeching strategy of the dominant one on the weaker or oppressed one (i.e. such a society consumes more than it produces, yet lives in plenty by drawing on weaker societies). Similarly, if the value is near or equal to 1 but there is still a large deficit in the basic resources, then this can be a sign of external leeching (i.e. such a society produces enough, but its resources are drawn away by a dominant one). This can also be the case if the society is trying to meet the global artificial standards and subsequently falls victim to the hegemony of the dominant ones. Another reason can be a lack of coordination within the society that leads to either wastage or concentration of the resources.
The table puts each society's ratio beside the share of its basic needs that actually reaches its people (from Part 3: enough food, drinking water, sanitation, electricity and health services; 1 means all of it reaches everyone).
| Society | Ratio, paid work (Part 1) | Share of the basic needs reaching the people (Part 3) |
|---|---|---|
| India | 0.71 | 0.85 |
| Egypt | 0.56 | 0.89 |
| Brazil | 0.52 | 0.94 |
| China | 0.50 | 0.95 |
| Russia | 0.47 | 0.94 |
| United States | 0.30 | 0.96 |
| Nigeria | not measurable | 0.58 |
· The lowest ratio, 0.30, stands beside the largest share reaching the people, 0.96.
· The two highest ratios, 0.71 and 0.56, stand beside the two smallest shares among the six, 0.85 and 0.89.
· No society's ratio is near 1.
· Where the least reaches the people (0.58), the ratio could not be measured (see Part 1).
Others' work and resources that nature cannot replace
Where each person draws more energy in a year from coal, oil, gas and uranium, the Participation to Burden ratio of Part 1 is lower. The energy drawn from coal, oil, gas and uranium, in kilowatt-hours a person in 2024: United States 72,494; Russia 67,943; China 32,560; Egypt 10,664; Brazil 9,546; India 7,200; Nigeria 2,182. In the six with both values, the rank agreement is −0.94, nearly an exact reverse. Across 60 economies, using a broader form of the ratio (all hours of work, not only NEP hours), the link is still there (−0.56), but it disappears when economies that command the same hours of human work per person, their own and other people's, in everything they use, are compared (−0.08). The common root of both is the hours of human work a society commands per person; the data cannot say which comes first.
Needs met on resources that do not satisfy the green check
Where each person draws more energy from coal, oil, gas and uranium, the worth level read against the set point is higher. This reading can be worked out even where the hours are not known: the hours given cancel out, which leaves 0.99 × the production adequacy of Part 3. Across the 126 societies that publish all six needs, the rank agreement is +0.73, and among the seven +0.61: where people's own work meets most of their needs, it does so on resources that do not satisfy the green check. Whether this too follows the hours of human work a society commands cannot be tested: those hours are known for only 51 economies, and nearly all of them already meet most of their needs. In hours alone, Nigeria, India and Egypt give about as many hours to the NEPs as the other four, or more (32.5 to 36.1 a week, against 25.6 to 32.6), but have the highest set points (36.4 to 45.1), because the same hour produces less there; so they reach the set point least. The test for VIL shows what this means: if those resources vanished, the hours of NEP work needed would rise in all seven while the hours given stay as they are, e.g. from 33.0 to 175.1 hours a week in the United States, from 36.4 to 93.9 in Egypt, and least of all from 45.1 to 53.0 in Nigeria, where machines do about 3% of the farm work (see Chart 21 in Part 5).
The VIL depth itself follows neither wealth, measured as the hours of human work a society commands per person (rank agreement −0.14 in the six where it is known), nor the other four values (rank agreements of 0.04 with the worth level, −0.09 with the ratio, −0.14 with the ratio of the richest 1%, −0.11 with the respect level). It follows each society's own choices: power from river water and fuel made from plants lower it; crops that fix their own nitrogen would lower it too, but only once the farm machines no longer run on coal, oil, gas and uranium. (A low depth can also mean a need met less: in one of the two shallowest societies, most people do not yet cook with gas or electricity.) So the gradual way out, i.e. raising a resource that satisfies the green check alongside the old one before the old one is withdrawn, is a matter of choice more than of wealth.
Giving where there is least
The giving half of the preference gradient is the share of one's own income given directly to people in need. Where the worth level read against the set point is higher, this share is lower; and where each person draws more energy from coal, oil, gas and uranium, this share is also lower. Both hold across the world, not only among the seven:
· Giving against the worth level read against the set point: −0.65 across 92 societies (−0.85 among the seven).
· Giving against the energy drawn from coal, oil, gas and uranium per person: −0.66 across 103 societies (−0.70 among the seven).
Across 56 economies, the share given also falls as the hours of human work commanded per person rise (−0.64). Among those same 56, the link between giving and the energy from coal, oil, gas and uranium (−0.43) disappears when economies that command the same hours of human work are compared (−0.03). This, too, follows the hours of work a society commands: those who have least give the largest share of what they have. It does not make having less a virtue; a burden that is forced down is not counted as voluntary suppression.
Weaker links
Other links were too weak to count as patterns, e.g. the ratio of the richest 1% against the share of output that does not reach the people (−0.21, and so close between two societies that even its sign is not firm), and the respect value against energy from coal, oil, gas and uranium (−0.68).
Put together, the solid links tell one plain story. Where people's own work meets most of their needs, it does so on resources that do not satisfy the green check, and what the society takes runs well beyond its own NEP work; across many economies, both follow the hours of human work a society commands per person. Where a society commands few, a larger share of what little there is gets given away. The formulas cannot prove which causes which, and they blame no one; they show where each society stands, and in which direction the pathway lies.
Using the formulas for any society
Each of Parts 1 to 5 ends with a worksheet for its own formula. Here they are joined into one roadmap. Use one year for all five as far as the data allow, and write down the year of every number.
Step 1: collect the common base
· People, and capable adults: World Bank, World Development Indicators, "Population, total" (SP.POP.TOTL) and the population aged 15 to 64 (SP.POP.1564.FE.IN, SP.POP.1564.MA.IN).
· Jobs and weekly hours actually worked, by economic activity: ILOSTAT (International Labour Organization).
· Time spent on unpaid domestic and care work: UN SDG indicator 5.4.1 (series SL_DOM_TSPD).
These serve Parts 1 and 3 directly, and through Part 3 also Parts 4 and 5.
Step 2: work out the five values in the order of Parts 1 to 5
| Order | Value | What it needs besides the common base | Why at this point |
|---|---|---|---|
| 1 | Participation to Burden ratio of the society (Part 1) | the hours of work contained in what the society consumes, imports included (OECD Trade in Employment) | it stands on its own |
| 2 | Ratio of the richest 1% (Part 2) | the hours of work contained in what the society uses (from step 1 of Part 1); each group's share of income after taxes (World Inequality Database); public services' share; managers' weekly hours (ILO); the paid NEP work needed per capable adult (from Part 3) | its sign decides how the group is counted in Parts 3 and 4 |
| 3 | Worth level (Part 3) | food, health workers, drinking water, sanitation, electricity and teachers, each against the need | it is a factor of Part 4 and is tested in Part 5 |
| 4 | Respect value (Part 4) | money given directly to people in need; caring acts; what parents choose to teach; the change in burden against societies that command the same hours of human work; hunger | it multiplies the preference gradient by the worth level of step 3 |
| 5 | VIL depth (Part 5) | the share of factory-made nitrogen on the fields and of wild-caught fish in the protein; farm fuel, farm electricity and the hours of farm work; cooking fuels; sources of electricity; transport fuels | it uses Part 5's green-check verdicts and the worth level of step 3 |
Where the ratio of the richest 1% is below zero, that group is regarded as worthless (see ARE YOU A WORTHFUL PERSON?) and counted at zero in the worth level (Parts 3 and 4); this is a step of calculation for a measured group, not a judgement of any person in it. If your society is not in the Trade in Employment table (as Nigeria is not), Part 1's worksheet gives a fallback, to be written down as an assumption, not a measurement.
Step 3: compare
Place each value first against its reference point, in the row under the heading of the table above; only then set it beside the seven. The reference point is the measure; the seven are only fellow travellers on the same road. Add your own society as a new row at the foot of the table, and work it out again year after year: a value that moves towards its reference point shows the pathway being walked. If a piece of data is missing, leave its cell empty and say why; a gap stated honestly is worth more than a number guessed.
A last word
The numbers in this section were not gathered to rank the societies of the world, nor to praise some and shame others. They were gathered for one purpose only: redemption at every level, from the individual to the society and the whole world, beginning with awareness, because what is seen clearly can be put right. Not one of the seven has yet reached the reference point in every value, so each of them still has a road ahead, and the rules that mark that road are the same for every society, including yours and mine. This invites you to transform, from the individual to the whole society:
If you want to witness it in reality, then apply these rules and see...